

Simply put, EBITDA = a company’s Earnings (net income on its income statement) + any Interest, Taxes, Depreciation and/or Amortization also shown on its income statement.
In this blog, we’re going to cover the following:
- What Is EBITDA?
- EBITDA vs. EBT and EBIT
- EBITDA vs. Operating Cash Flow
- Adjusted EBITDA and EBITDA Margin
- EBITDA Formula + Calculations
- Adjusted or Normalized EBITDA
- What is an EBITDA Bridge?
- The Drawbacks of EBITDA
- EBITDA and Leveraged Buyouts
- How Is EBITDA Used in Business Valuation?
What is EBITDA?
EBITDA is a shorthand way for investors to determine how much cash a company generates, especially in comparison to other firms.
It allows us to quickly look at the core cash earnings of a company by eliminating the impact of capital structure and excluding income taxes and certain other non-cash expenses that appear on the income statement.
The amount of interest a company pays is dependent on how much funded debt that firm has on its balance sheet.
If a company has a lot of debt relative to its equity then we say it’s got a ‘leveraged balance sheet.’ Different companies have different levels of debt.
This is not necessarily a good or bad thing, rather it's just something that’s different from firm to firm.
If a business has a lot of debt it will have a lot of interest expense while the identical business without any debt will obviously have zero interest expense. This is why we want to eliminate the impact of capital structure when we are evaluating earnings.
Said another way, because the debt structure of a company is not related to how much cash its operations generate, only where that cash goes, we add interest back to calculate EBITDA.
The same principle holds true for taxes.
Much like debt, the amount of tax a company pays is highly dependent upon such things as its corporate form (S Corp v. C Corp, for instance), its accounting practices, the amount of debt it has, and other factors not related to its operating performance.
This is why we add taxes back to calculate EBITDA.
Why do we add-back depreciation and amortization?
Depreciation and amortization are non-cash charges against earnings.
Depreciation reflects the declining value of a tangible asset (like a piece of equipment) as it wears out or becomes obsolete.
Amortization reflects the declining value of an intangible asset (like a patent) as its useful life declines.
The accounting treatment of depreciation and amortization rarely reflect the real "costs" associated with acquiring/owning these assets and, since they are non-cash charges, adding back depreciation and amortization better reflects current-period cash flows.
There is one important caveat related to depreciation and amortization: buying tangible assets like equipment or trucks is a real cash cost (which we typically refer to as capital expenditures or ‘capex').
Capex shows up on the balance sheet in the form of additional fixed assets instead of on the income statement as an expense.
So especially for businesses that have recurring capital expense needs, we often refer to its ‘EBITDA less capex.'
That way we can better reflect its cash earnings in comparison to other firms with lower recurring capex needs.
Warren Buffet’s annual shareholder letter from 2002 provides a glimpse into the rationale for deducting capital expenditures from EBITDA.
EBITDA vs. EBT and EBIT
Just as EBITDA is a short-hand calculation to approximate the cash produced by a business, EBIT and EBT are further simplifications.
EBIT is simply Earnings Before Interest and Taxes and is roughly equivalent to a company’s Operating Income. Operating Income is typically a subtotal found on a company’s profit and loss statement and calculated as Gross Profit - Operating Expenses.
EBIT can be a proxy for a company’s cash flow when that company has lots of recurring capital expenditures, such as one that uses lots of vehicles or which needs to buy new equipment every few years to stay competitive in its industry. Because Depreciation and Amortization are excluded from the calculation, EBIT assumes that the company’s depreciation expenses will generally line up with its capital expenditures each year.
EBT is Earnings Before Taxes but inclusive of interest. Also known as pre-tax income.
EBITDA vs. Operating Cash Flow
As described in the opening paragraphs, EBITDA is a shorthand way for investors to determine how much cash a company generates by eliminating the impact of capital structure on its earnings and by also excluding certain other non-cash expenses that appear on the income statement.
However, EBITDA does not account for the cash used in a business to fund changes in working capital. Working capital is the cash or liquidity required to operate a business. Read more on working capital from Investopedia.
Operating Cash Flow is found on a company’s statement of cash flows. It also provides a view into how much cash a company generates. Like EBITDA, it excludes certain non-cash expenses like depreciation. However, Operating Cash Flow is different from EBITDA in two respects:
- Operating Cash Flow uses Net Income as its earnings starting point so it does not eliminate the impact of capital structure on earnings (that is, interest expense is included in Net Income).
- Operating Cash Flow does take into consideration changes in net working capital
Adjusted EBITDA and EBITDA Margin
Practitioners like Hadley often add non-recurring items back to EBITDA. These “add-backs” reflect expenses that a buyer expects will not be in the business in the future such as:
- Duplicative rent during a move to a new facility;
- Expenses related to implementing a major new enterprise software solution;
- A business owner’s above market compensation and/or perks, such as a luxury car lease.
Just as there are positive add backs to EBITDA, there can also be negative adjustments. Examples of negative adjustments may include:
- The addition or replacement of a key management position (at a new or higher salary amount)
- One time project or revenue that is non-recurring
The net result of positive add-backs and negative adjustments included in EBITDA is referred to as ‘adjusted EBITDA’. That is, EBITDA is adjusted to present a more normalized view of cash flow.
Finally, a company’s ‘adjusted EBITDA margin’ is another very important indicator of its relative performance.
EBITDA margin = Adjusted EBITDA/Total Revenue
EBITDA margin is expressed as a percentage. We like to see adjusted EBITDA margins of 10% or greater. We’ve written at greater length on EBITDA margins.
EBITDA Formula + Calculation
When it comes to actually calculating EBITDA, the formula itself is quite straightforward:
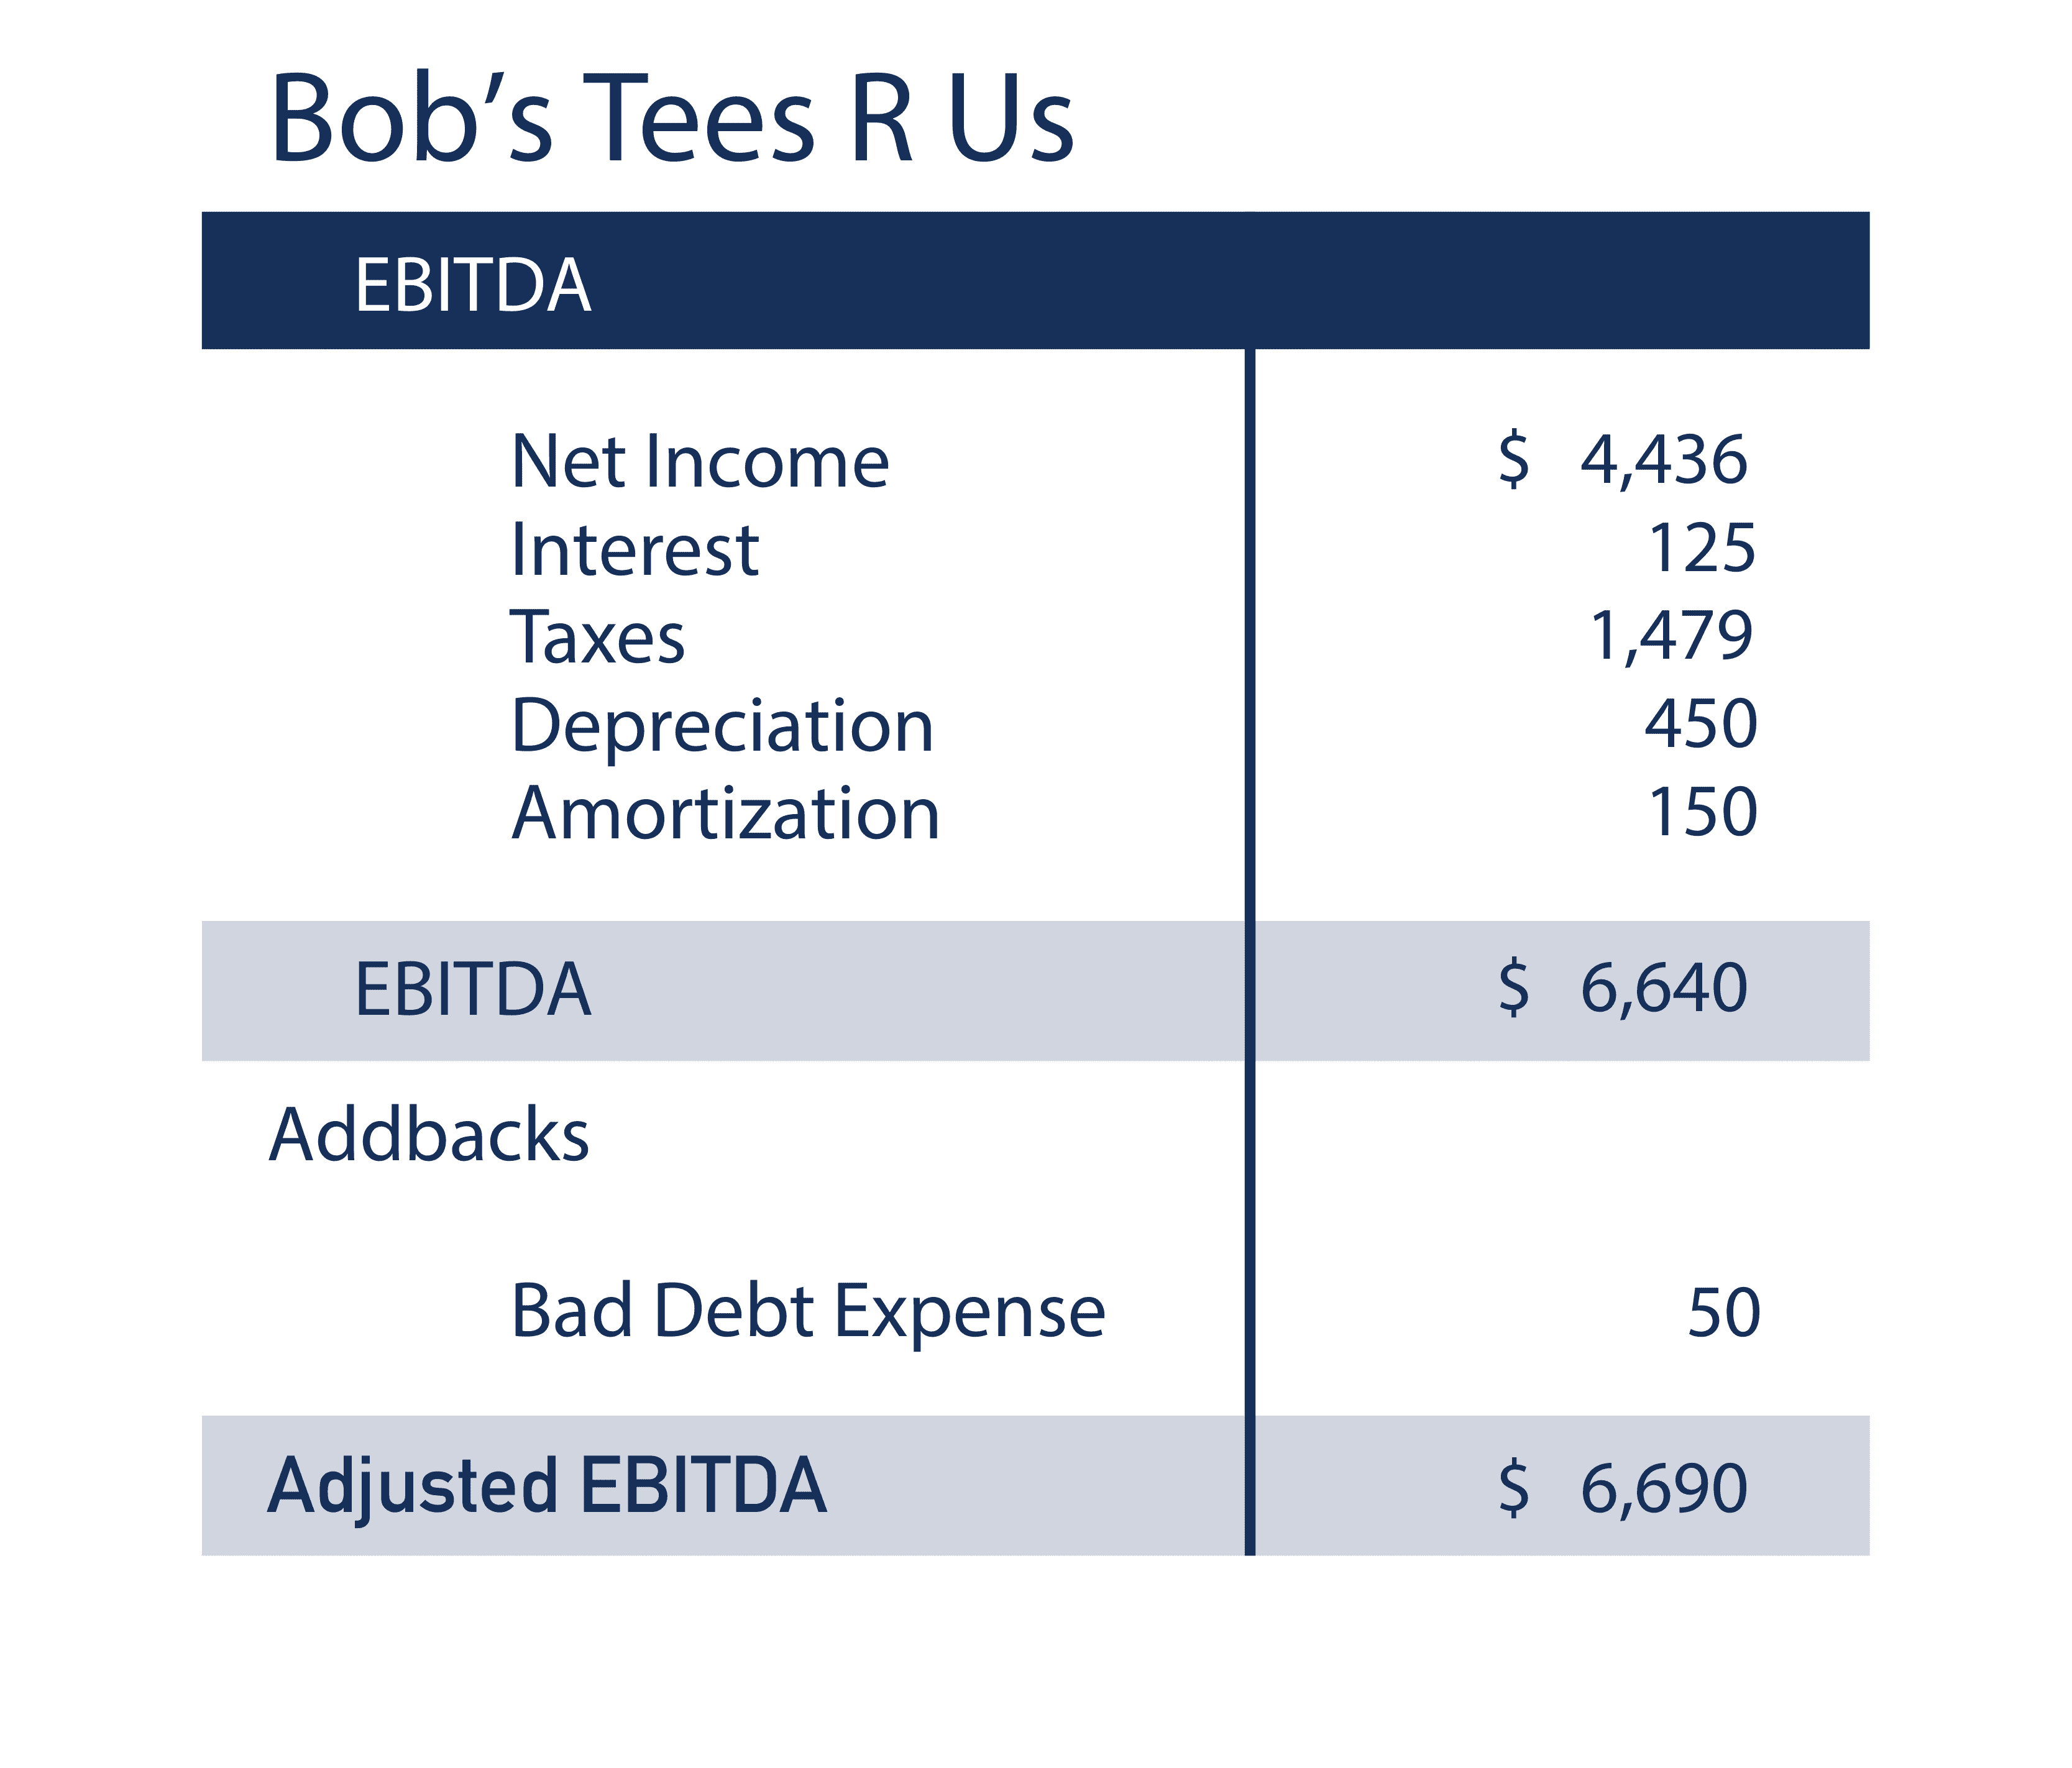
EBITDA = Net Income + Interest + Taxes + Depreciation + Amortization
E = Net Income
B = Before the following
I = Interest
T = Taxes
D = Depreciation
A = Amortization
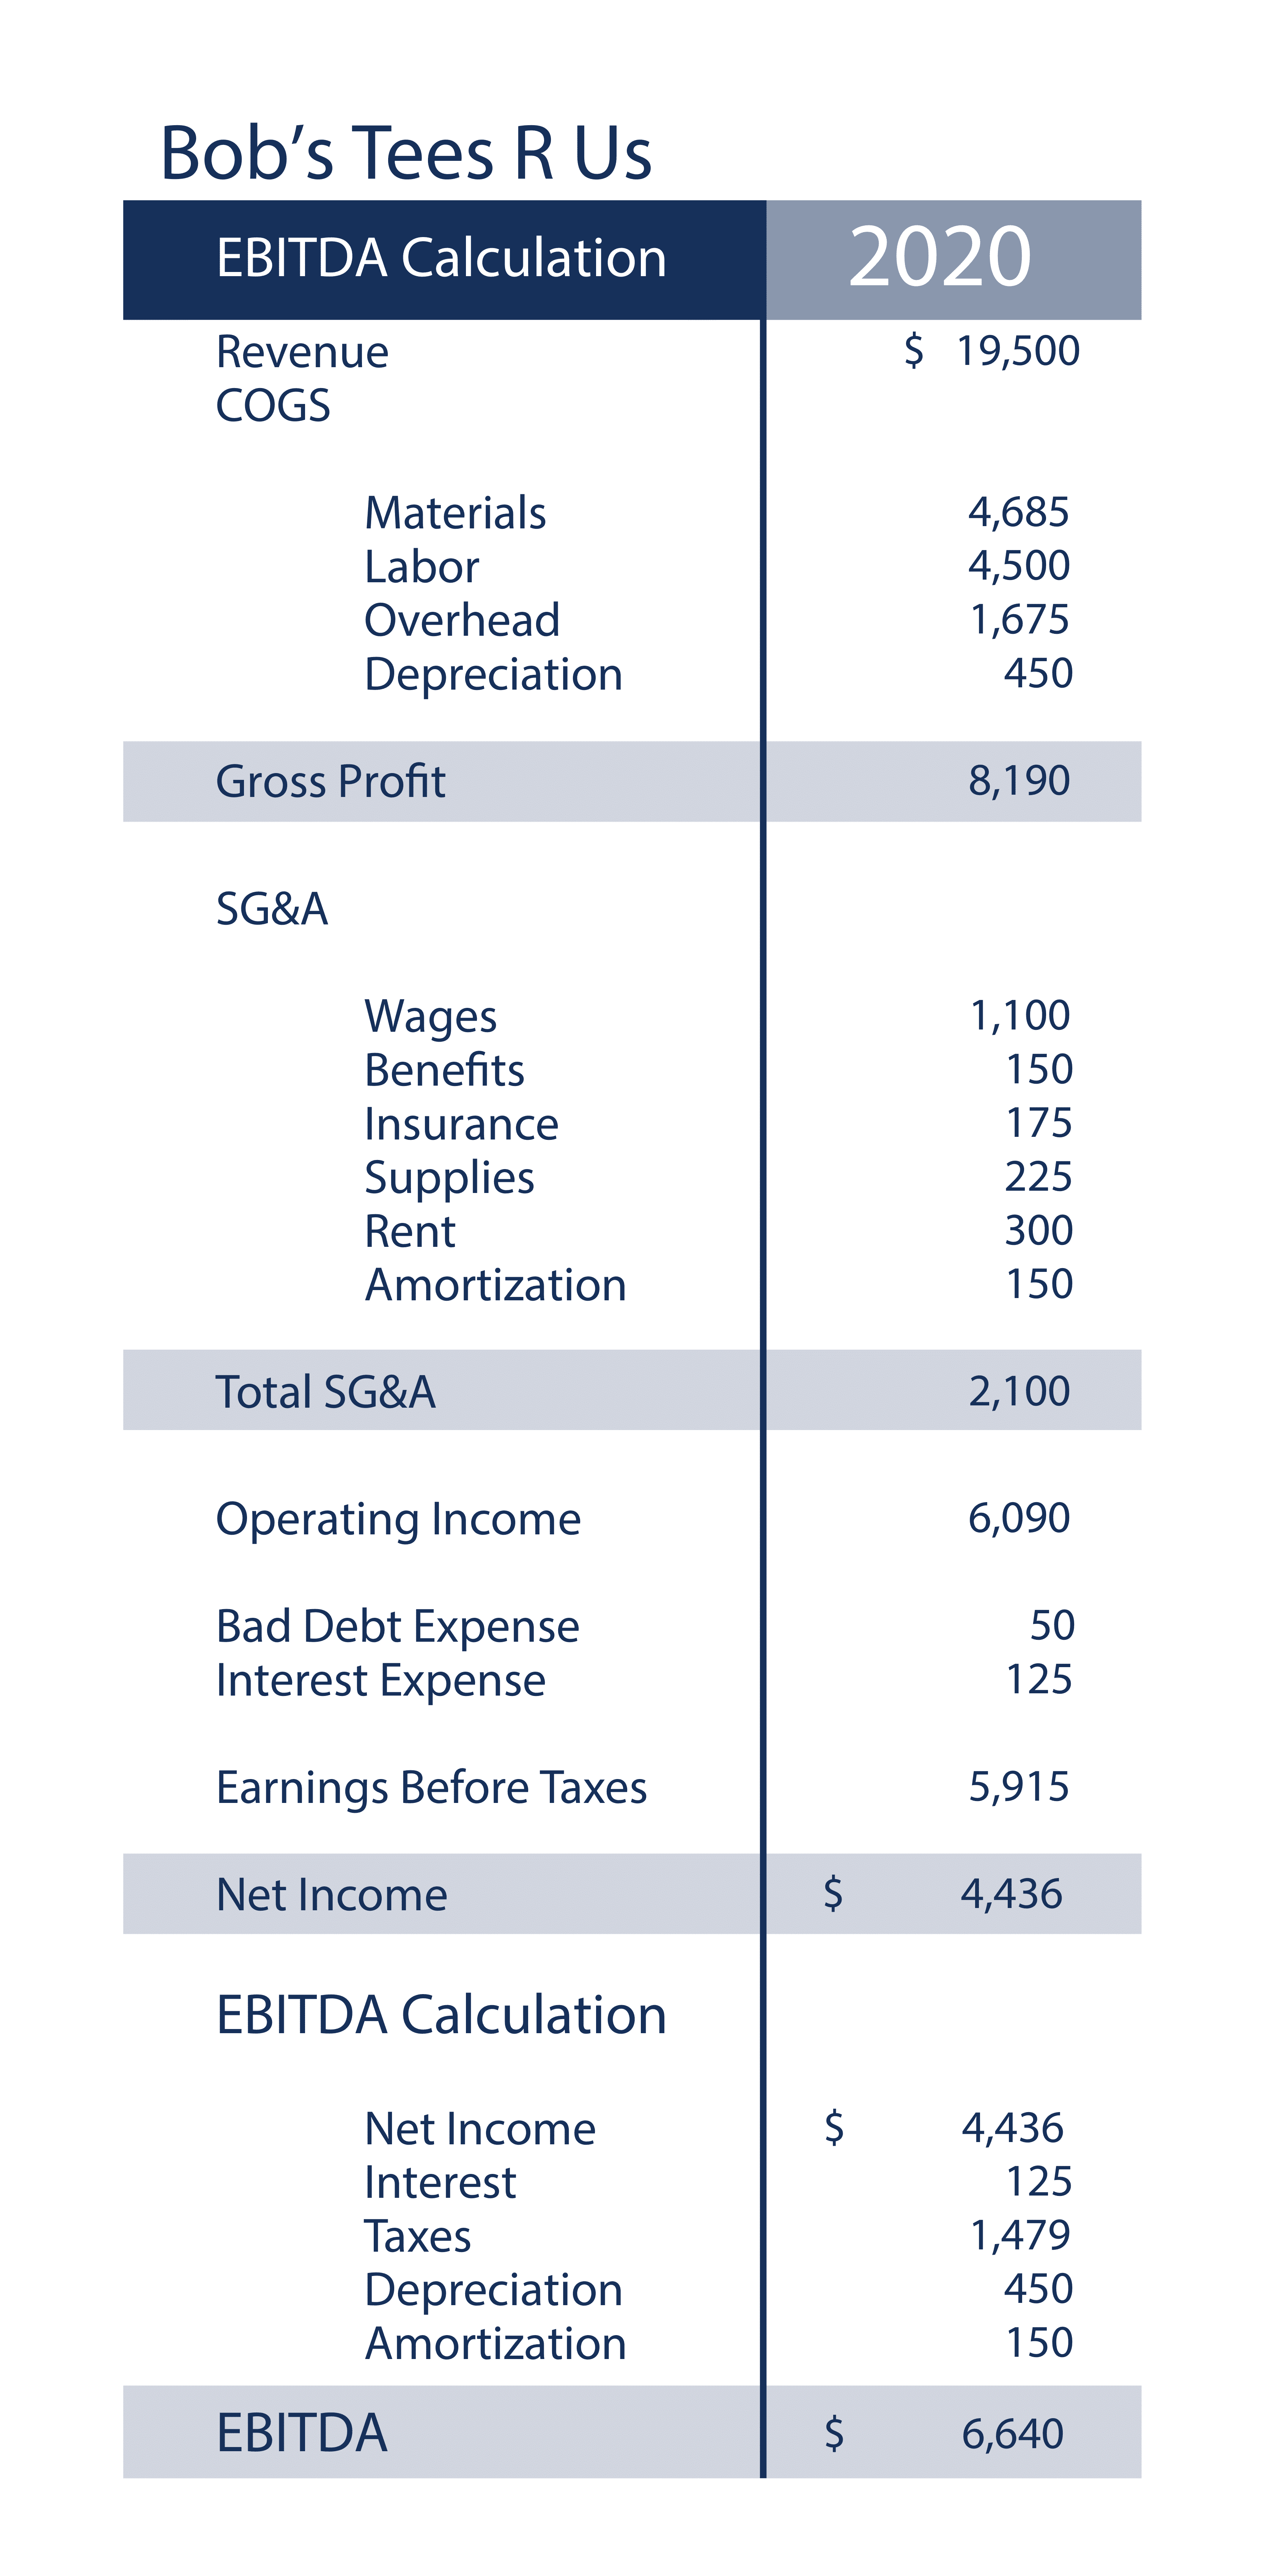
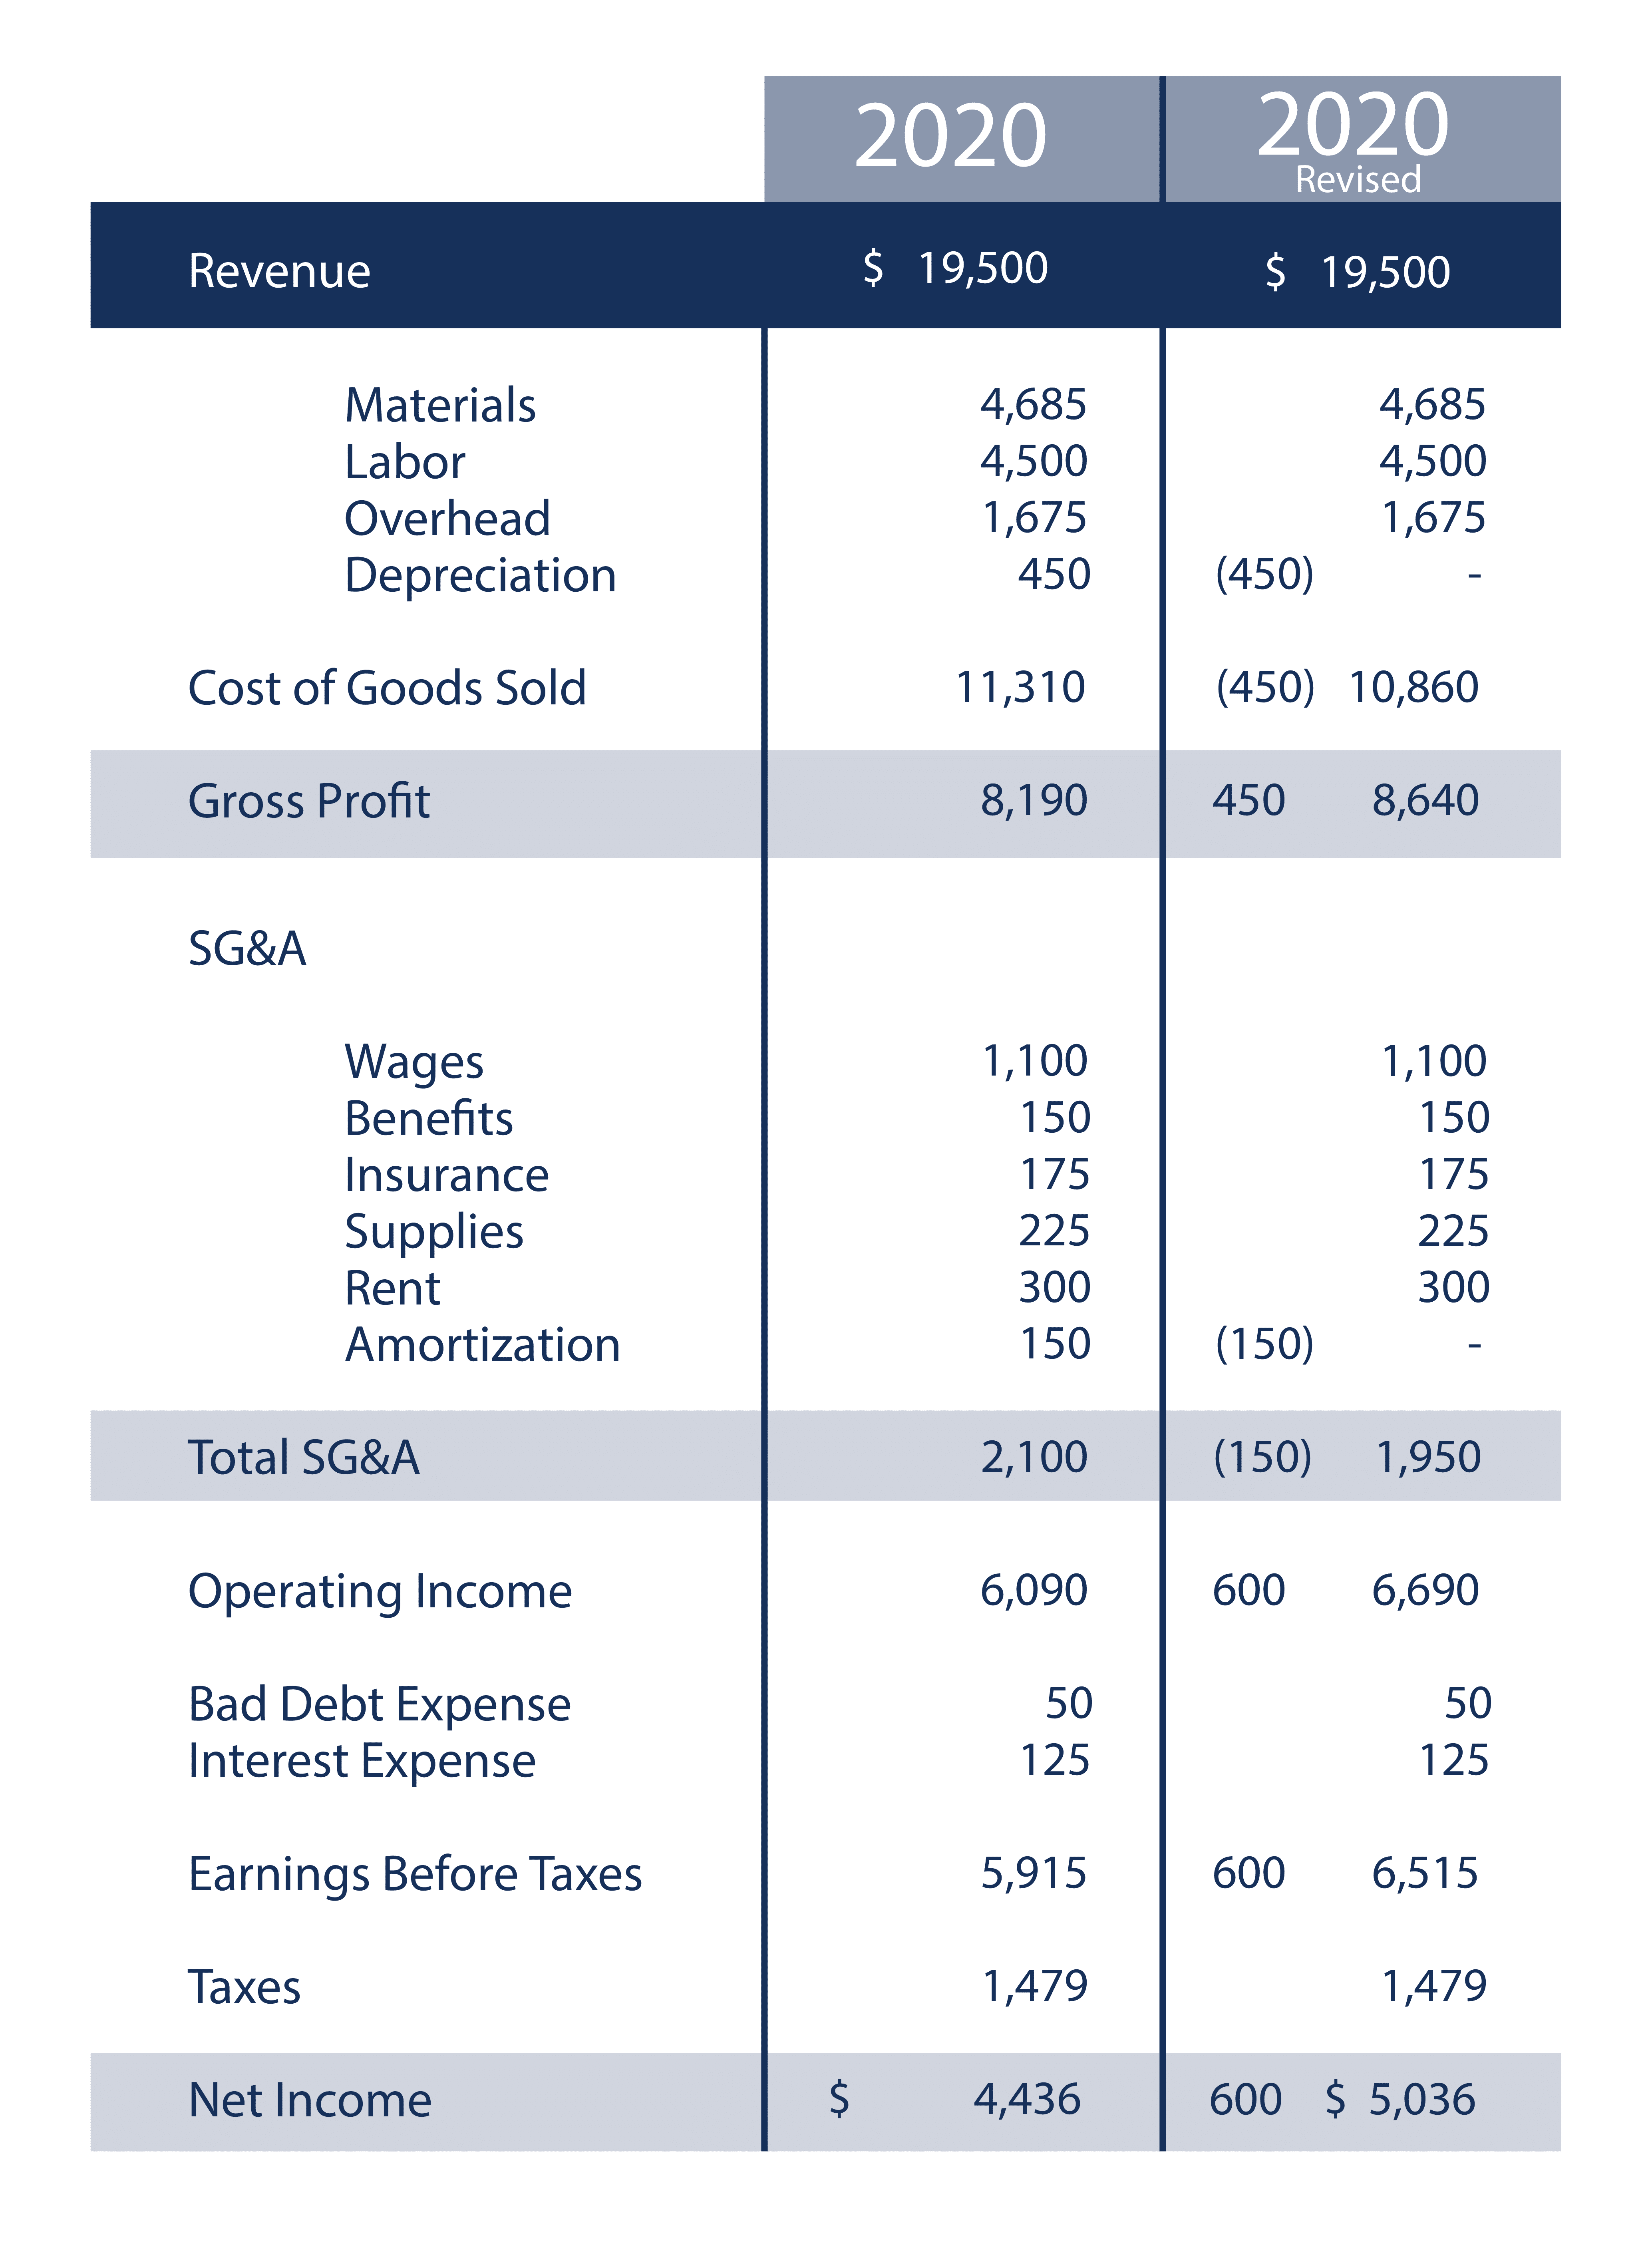
We’ve found that it is helpful to provide detailed examples of calculations like EBITDA. We created a fictional business called Bob’s Tees R Us to help with these examples.
In this case, we will use Bob’s Tees income statement, presented below, to calculate EBITDA:
EBITDA = Net Income + Interest expense + Taxes + Depreciation + Amortization
Adjusted or Normalized EBITDA
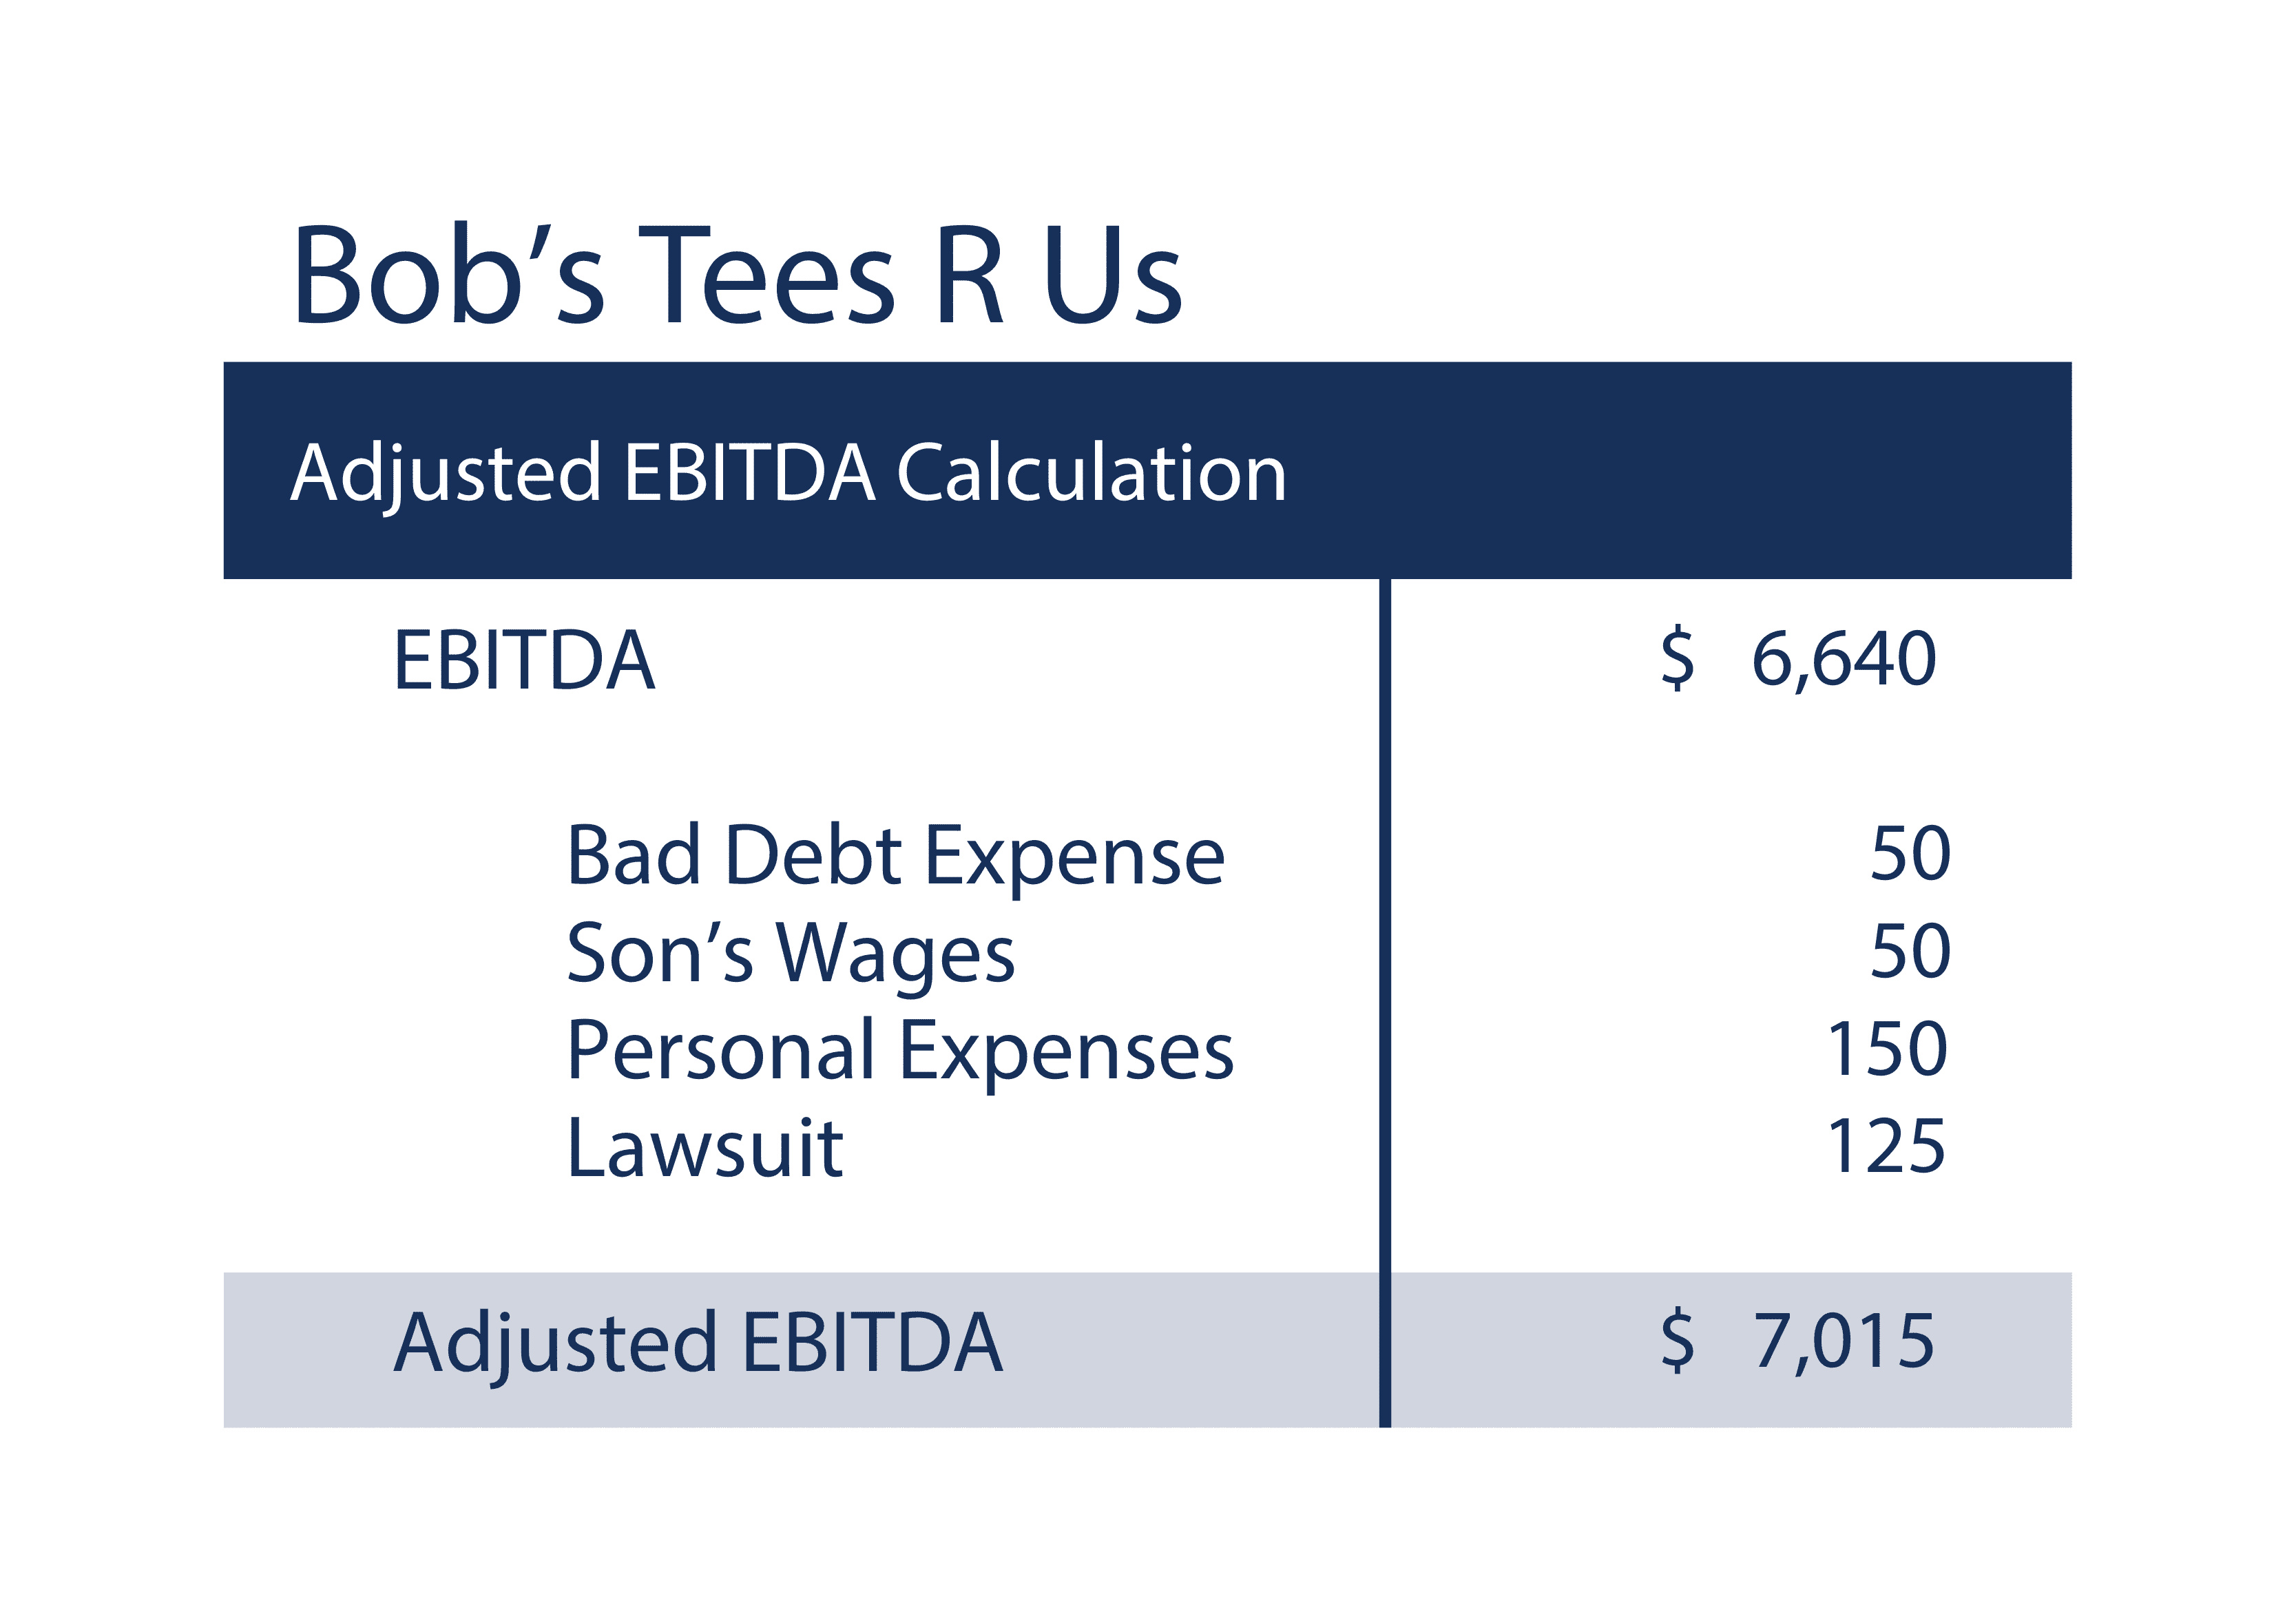
The next step in the process is to adjust EBITDA for unusual or non-recurring items.
For example, Bob received a $50,000 order to a company that subsequently went out of business. Bob subsequently wrote-off $50,000 of uncollectible receivable as bad debt expense in his 2020 profit and loss statement presented above. Given the one-time nature of this event, it might make sense to adjust the historical earnings by adding this expense back to Net Income when calculating EBITDA.
To take the example further, at Tees R Us, Bob has an employee who does not work. His son is on the payroll but prefers to spend his time practicing drums. In addition, his son is highly compensated for not working – he makes $20 per hour or about $50,000 per year.
Furthermore, Bob runs some personal expenses through the company including his golf club dues because he regularly hosts customers at his golf club. His golf club expenses totalled about $15,000 last year but this form of customer entertainment is not critical to maintaining these relationships going forward. Finally, Bob lost a labor lawsuit with a former employee and had to pay a $125,000 settlement. Hopefully, this is nonrecurring!
Taking all these items into consideration, Tees R Us has an adjusted EBITDA as follows.
EBITDA Margin
Bob’s Tees EBITDA Margin is simply Adjusted EBITDA/Total Revenue.
$7,015/$19,500 = 36%
What is an EBITDA Bridge?
Another way we use EBITDA is to build an EBITDA bridge to allow us to see in more detail what is contributing to a company’s changes in cash flow from one period to the next.
A simple EBITDA bridge can be completed in four steps.
Let’s go back to Bob’s Tees R Us to walk through the process of building an EBITDA bridge:
- Step One: From Bob’s Tees income statement, remove interest, taxes, depreciation, and amortization embedded in Cost of Goods Sold and SG&A in 2019
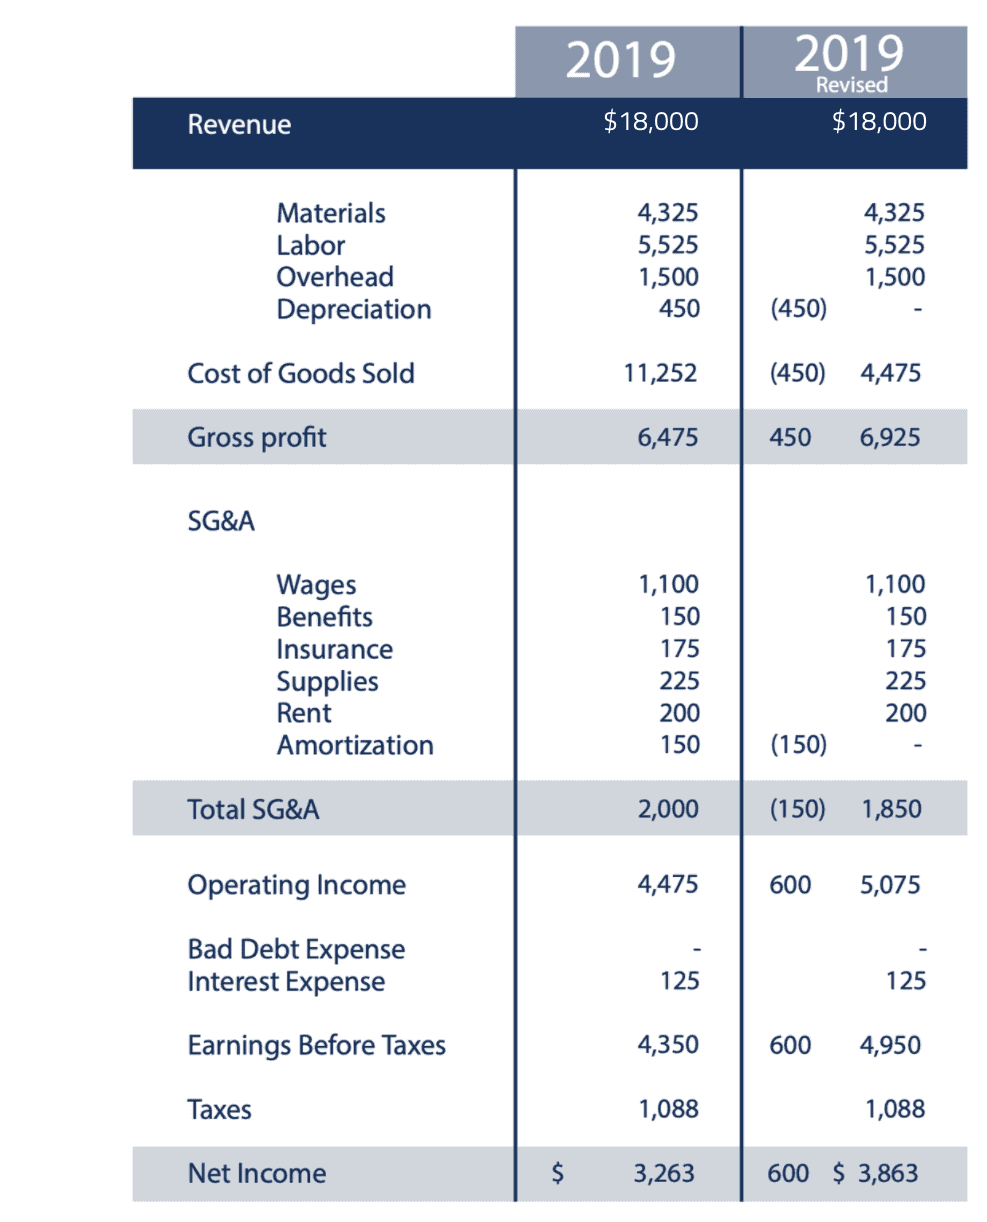
Then to do the same for 2020.
Step Two: Use the resulting adjusted gross profit % from 2019 and multiply it by the difference in revenue between 2019 and 2020.
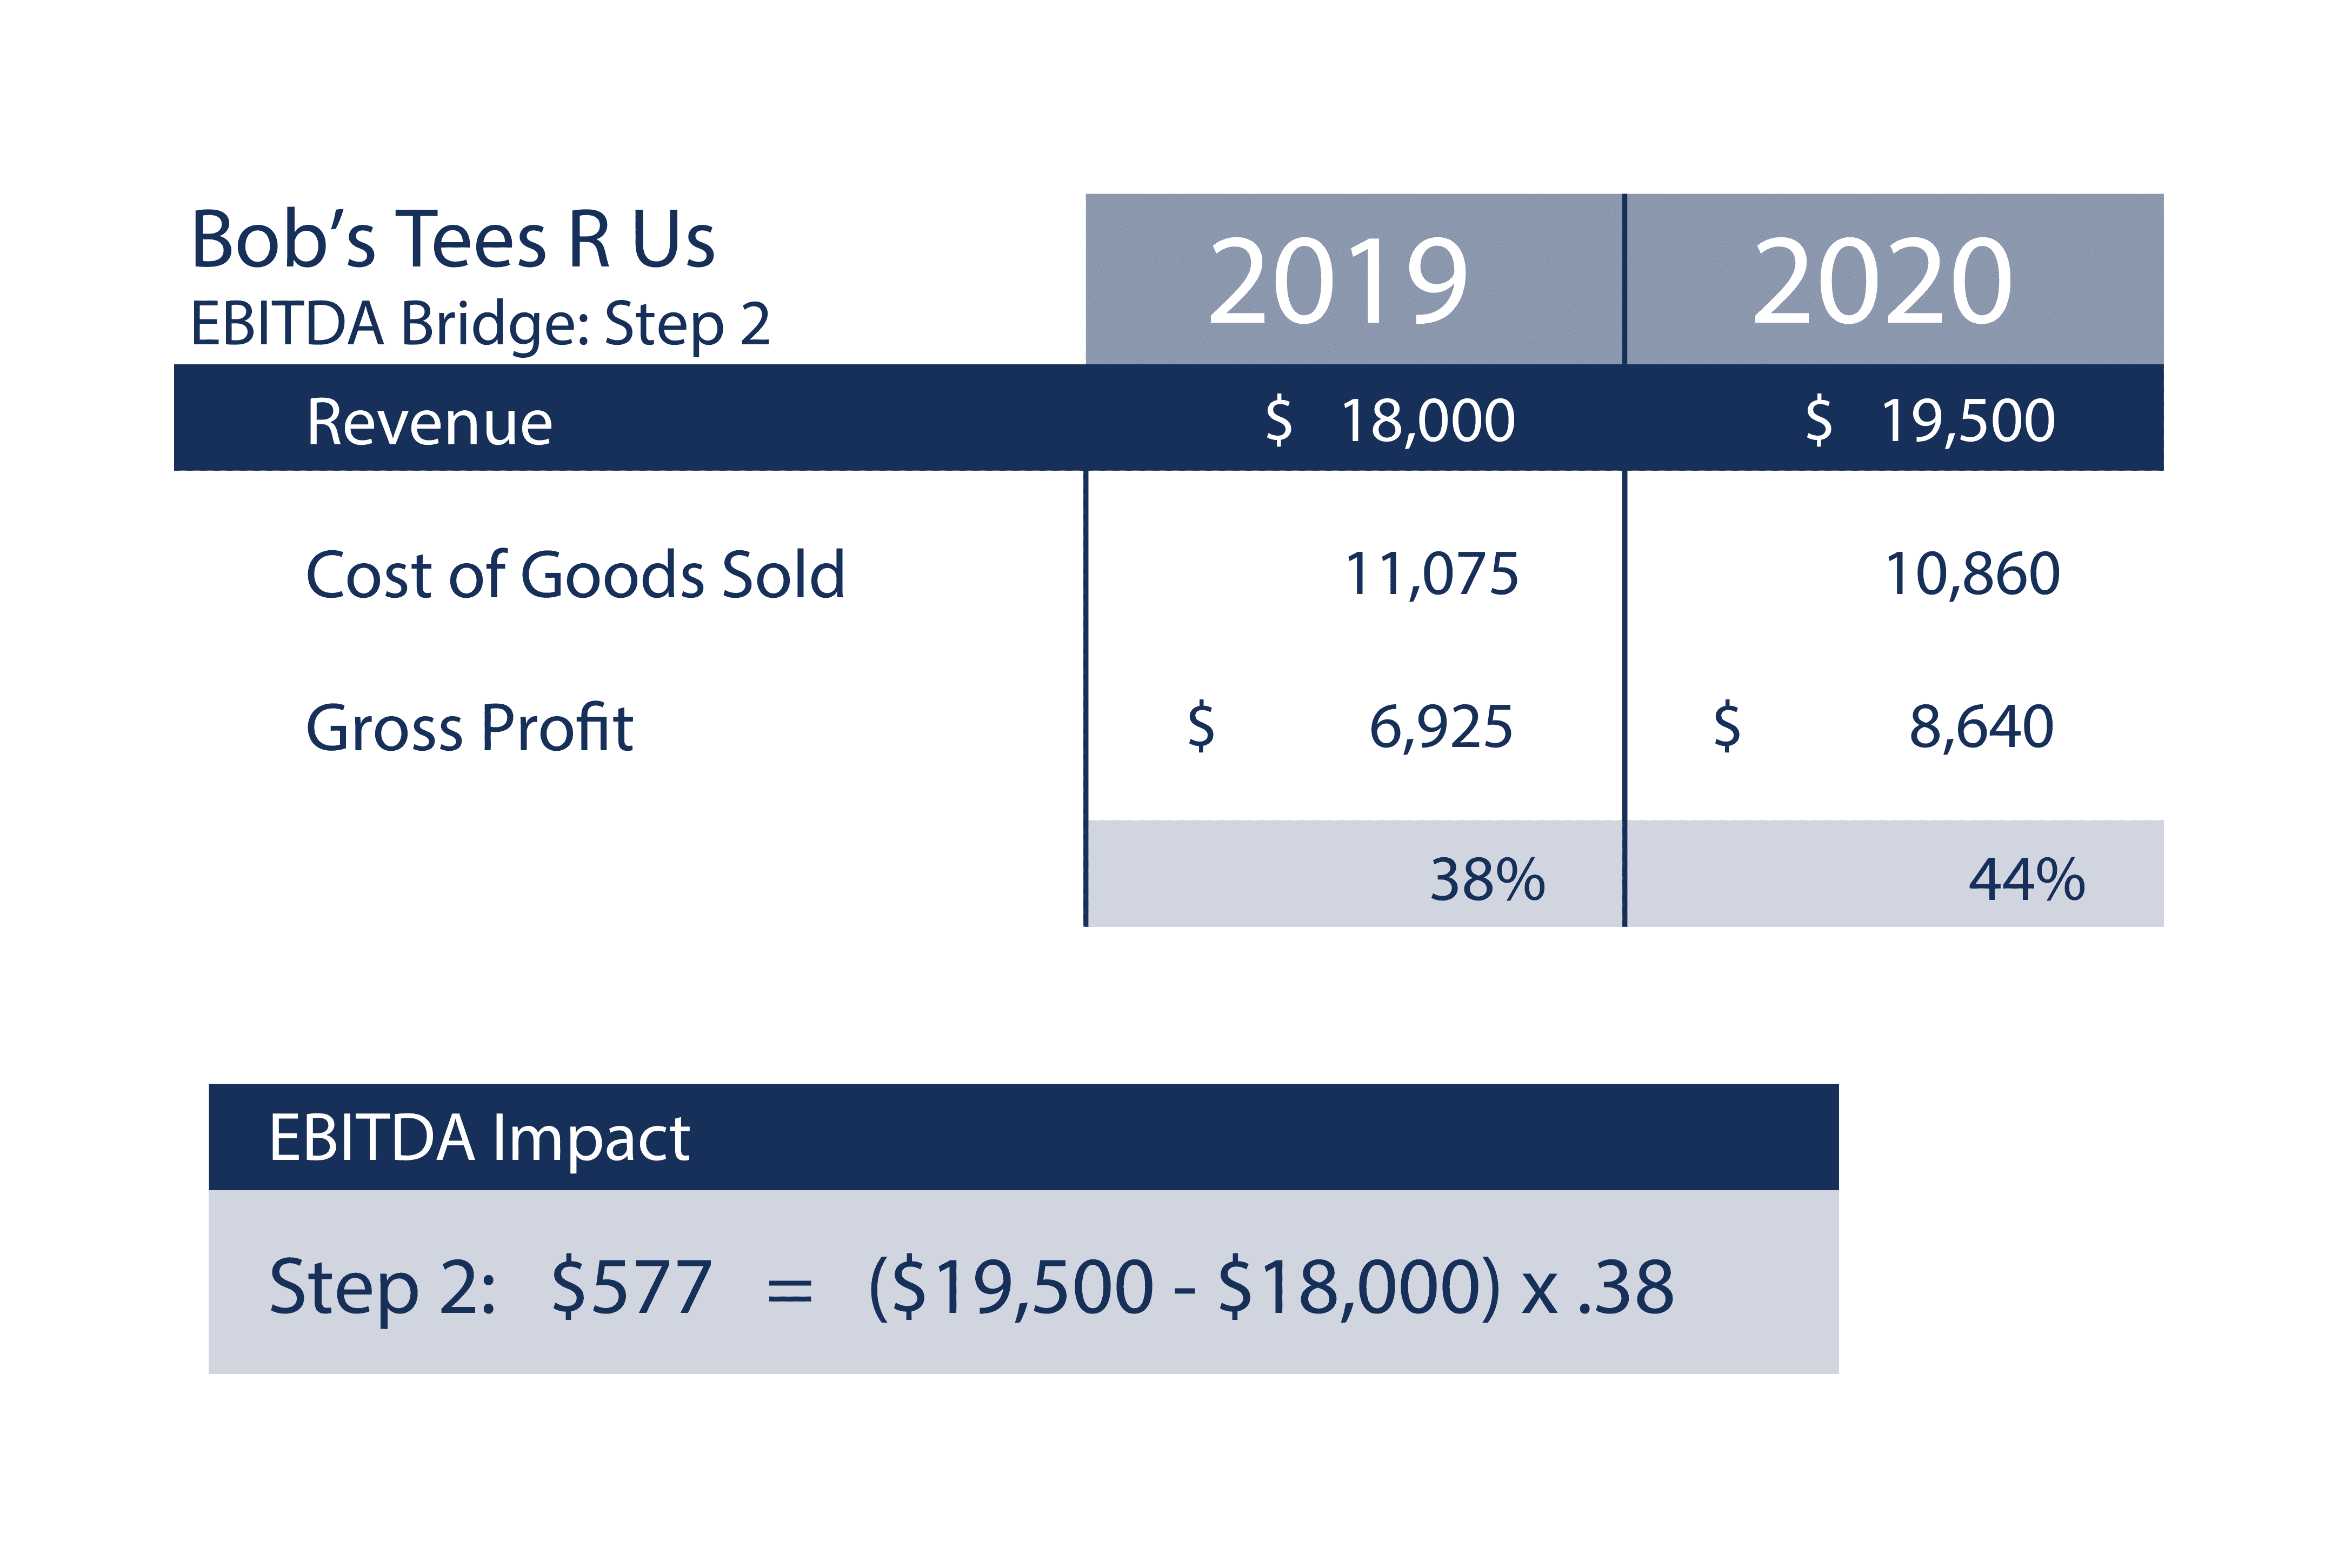
The result ($577) is the amount of the EBITDA change attributable to the growth or reduction in revenue between 2019 and 2020.
EBITDA Bridge Takeaway: Bob’s Tees experienced solid revenue growth over the last year of $1,500. Thanks to high gross margins and relatively fixed overhead, EBITDA will increase by $577.
Step Three: Then, take the amount from Step 2 and subtract it from the actual change in gross profit dollars between the periods.
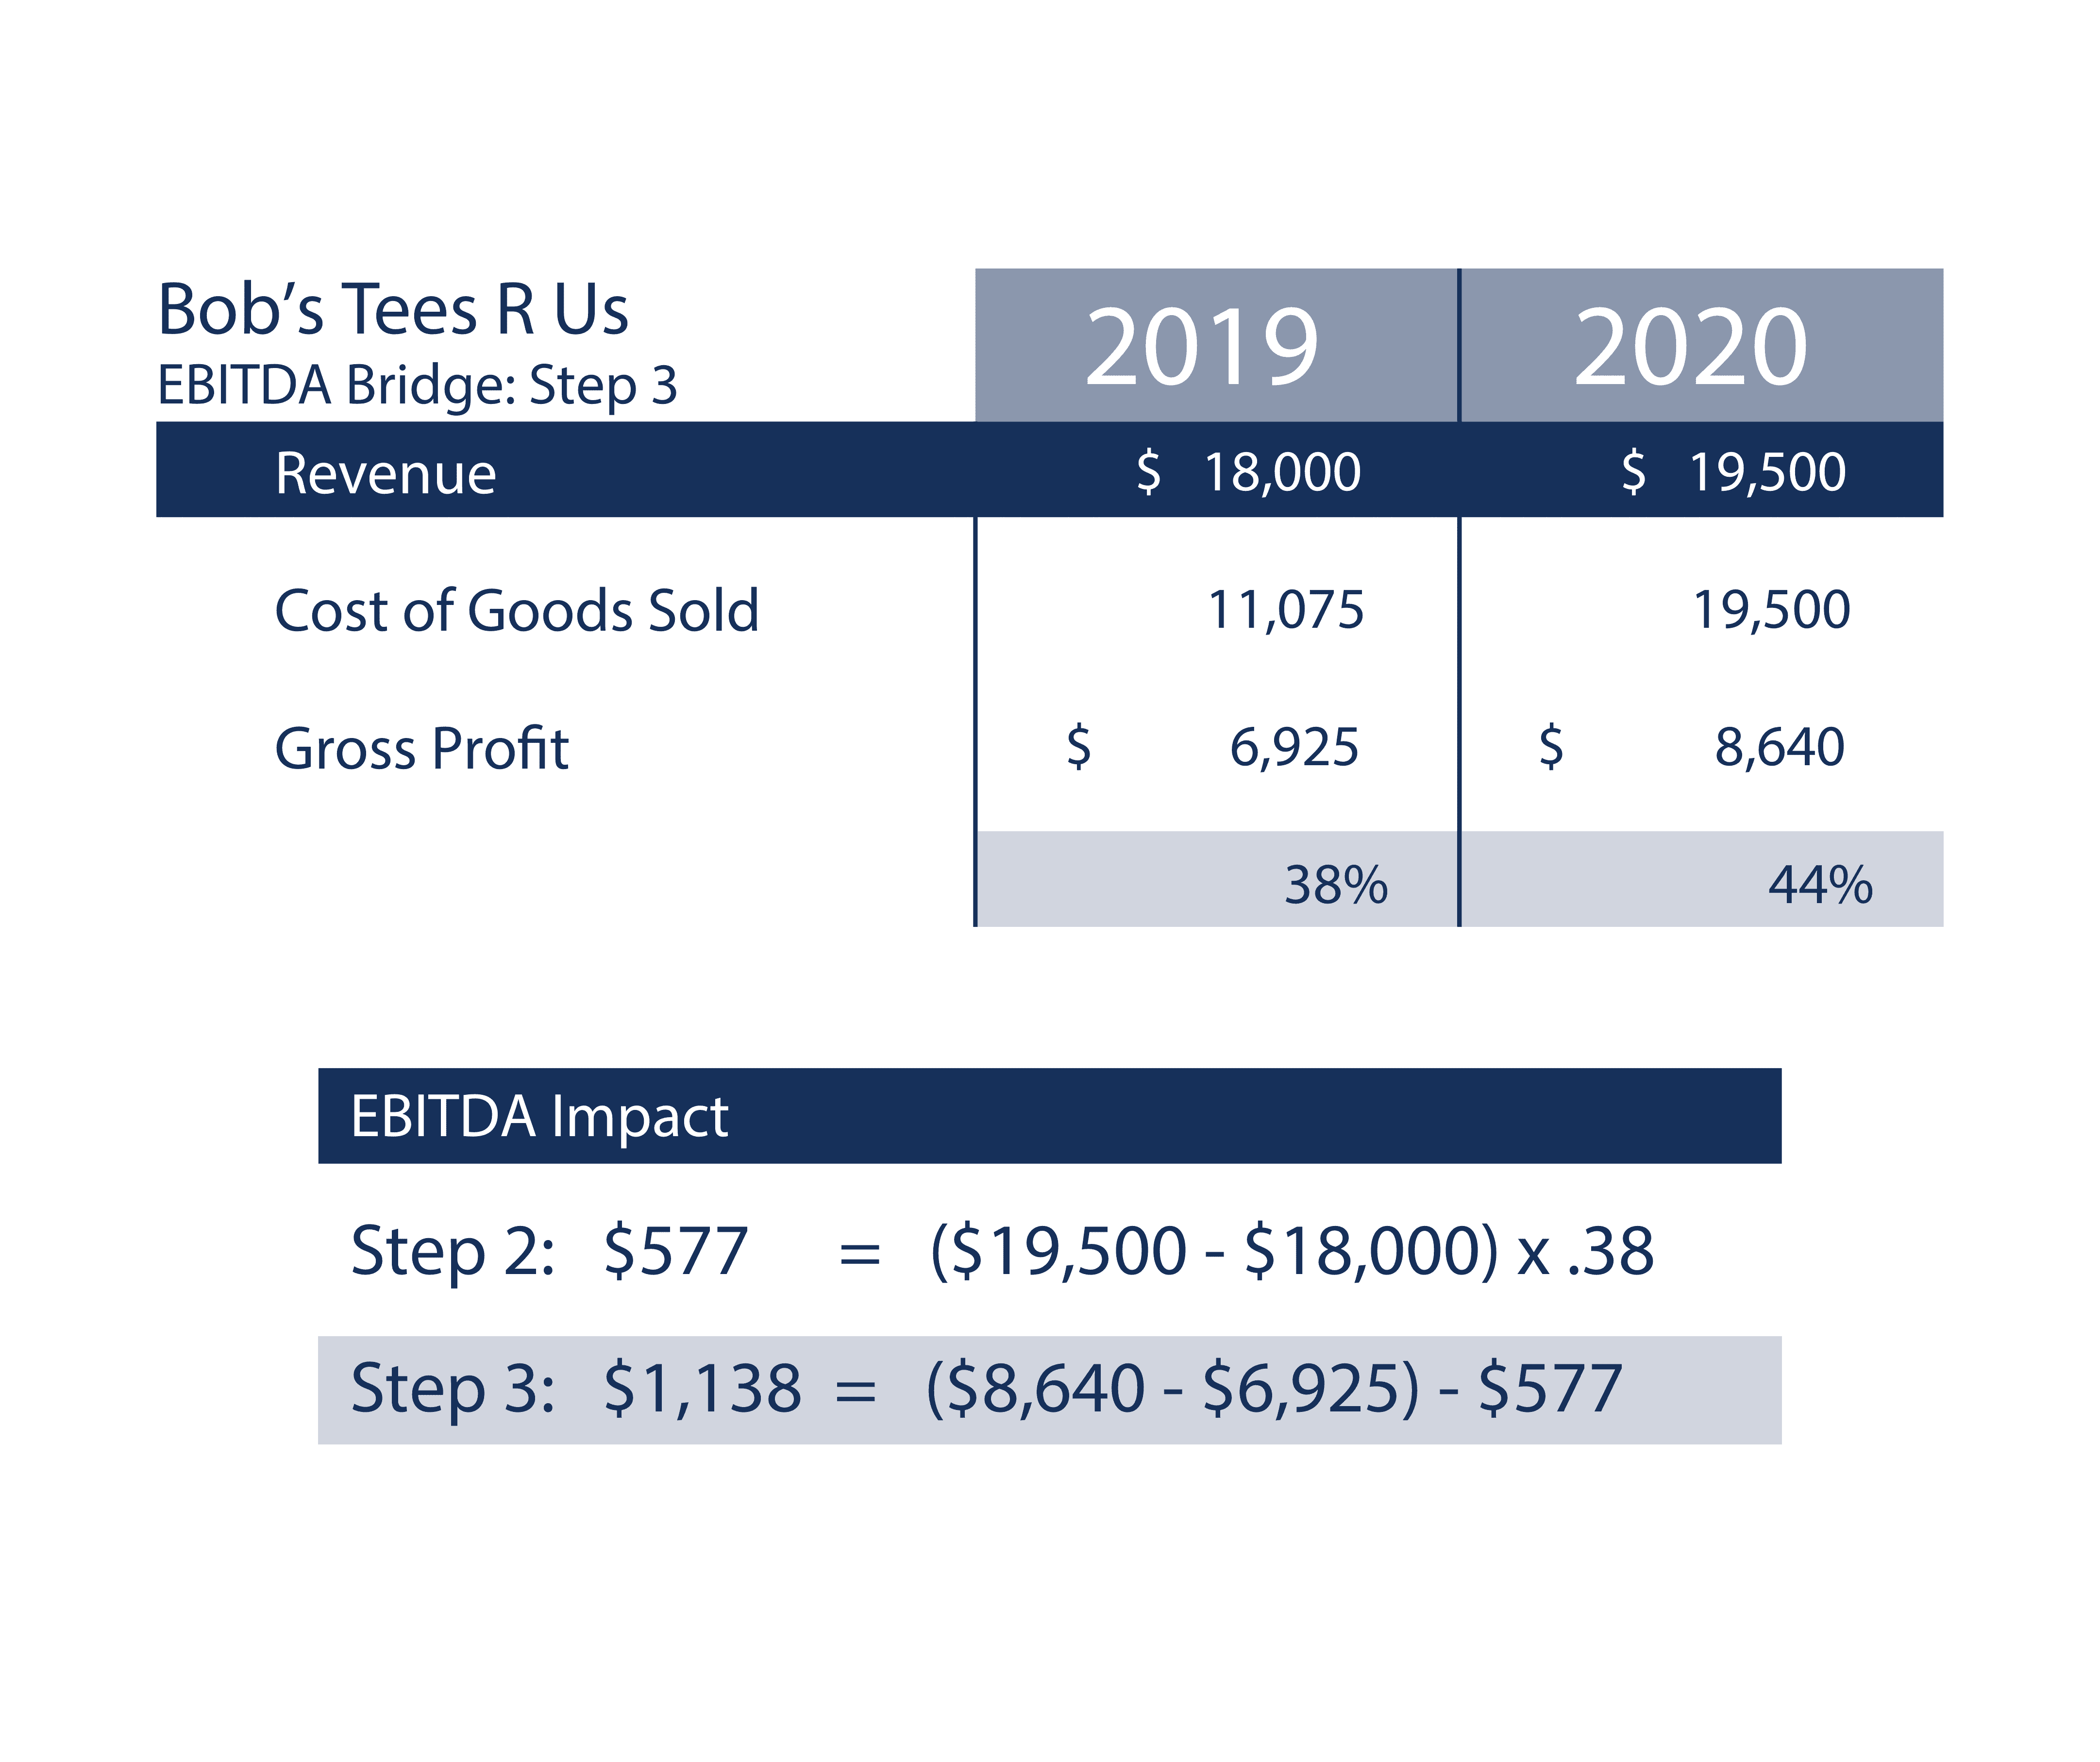
This is the amount ($1,138) of the EBITDA difference that is attributable to the change in the gross profit % between 2019 and 2020.
EBITDA Bridge Takeaway: Bob’s Tees improved its gross profit margin in 2020 due to a significant reduction in labor expense. The combination of more revenue and higher gross profit margins results in EBITDA increasing by $1,138.
- Step Four: Next, look at any changes to the amount of SG&A. That’s the amount of the EBITDA change that’s attributable to changes in the company’s overhead expenses.
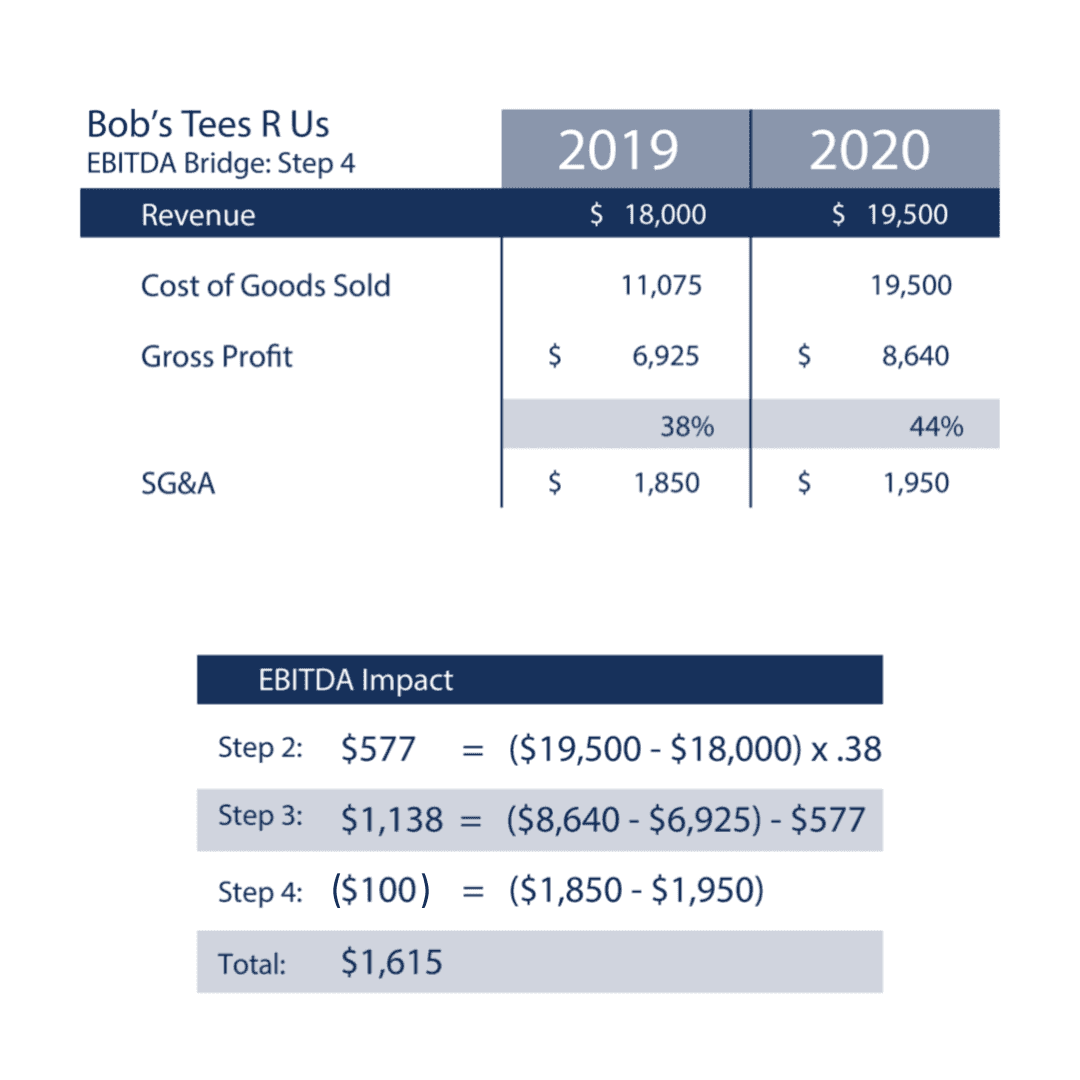
EBITDA Bridge Takeaway: Bob’s Tees has done a nice job keeping a lid on operating expenses during a period of growth. The increase in rent from $200 to $300 results in an EBITDA decrease of $100 between periods. Overall, despite a small increase in operating expenses, EBITDA increased by $1,615 due to higher revenue and improved gross margins.
An EBITDA bridge is an effective tool for comparing multiple periods in a row and to create insights into how a business is performing and adapting over time. While our example covers only two periods, it is not uncommon for an EBITDA bridge to cover many periods.
The Drawbacks of EBITDA
EBITDA is a very useful metric for understanding a company’s cash flow especially in relation to other firms from an investor’s perspective.
That said, it has its limitations as in the end it is really just an abbreviated proxy for cash flow.
In order to fully evaluate a firm’s cash flow, which is very important to investors like Hadley who seek to use leverage to affect their transactions (thus the term ‘leveraged buyouts’), we utilize much more complete financial models.
EBITDA and Leveraged Buyouts
These financial models seek to account for all of the factors that can impact a firm’s cash flow, including its working capital and capex needs (which can be very significant, especially during times of growth), and shows us the impact of using various forms of leverage such as bank term debt, bank lines of credit and mezzanine debt.
Debt is a very useful tool in the world of leveraged buyouts but having too much debt relative to a firm’s cash flow is a problem we want to avoid. Thus, we seek to fully understand a target company’s cash flow, not just its EBITDA.
But in terms of a shorthand way to understand a company, there’s no metric we use more than EBITDA.
How Is EBITDA Used in Business Valuation?
EBITDA is used to approximate the enterprise value of a business by multiplying EBITDA by a factor (called an EBITDA Multiple) to arrive at a valuation.
To determine a company’s EBITDA valuation, we take its recent annual EBITDA (or its EBITDA less Capex or EBIT, as the case may be) and multiply it by an EBITDA Multiple, typically between 4 and 5.
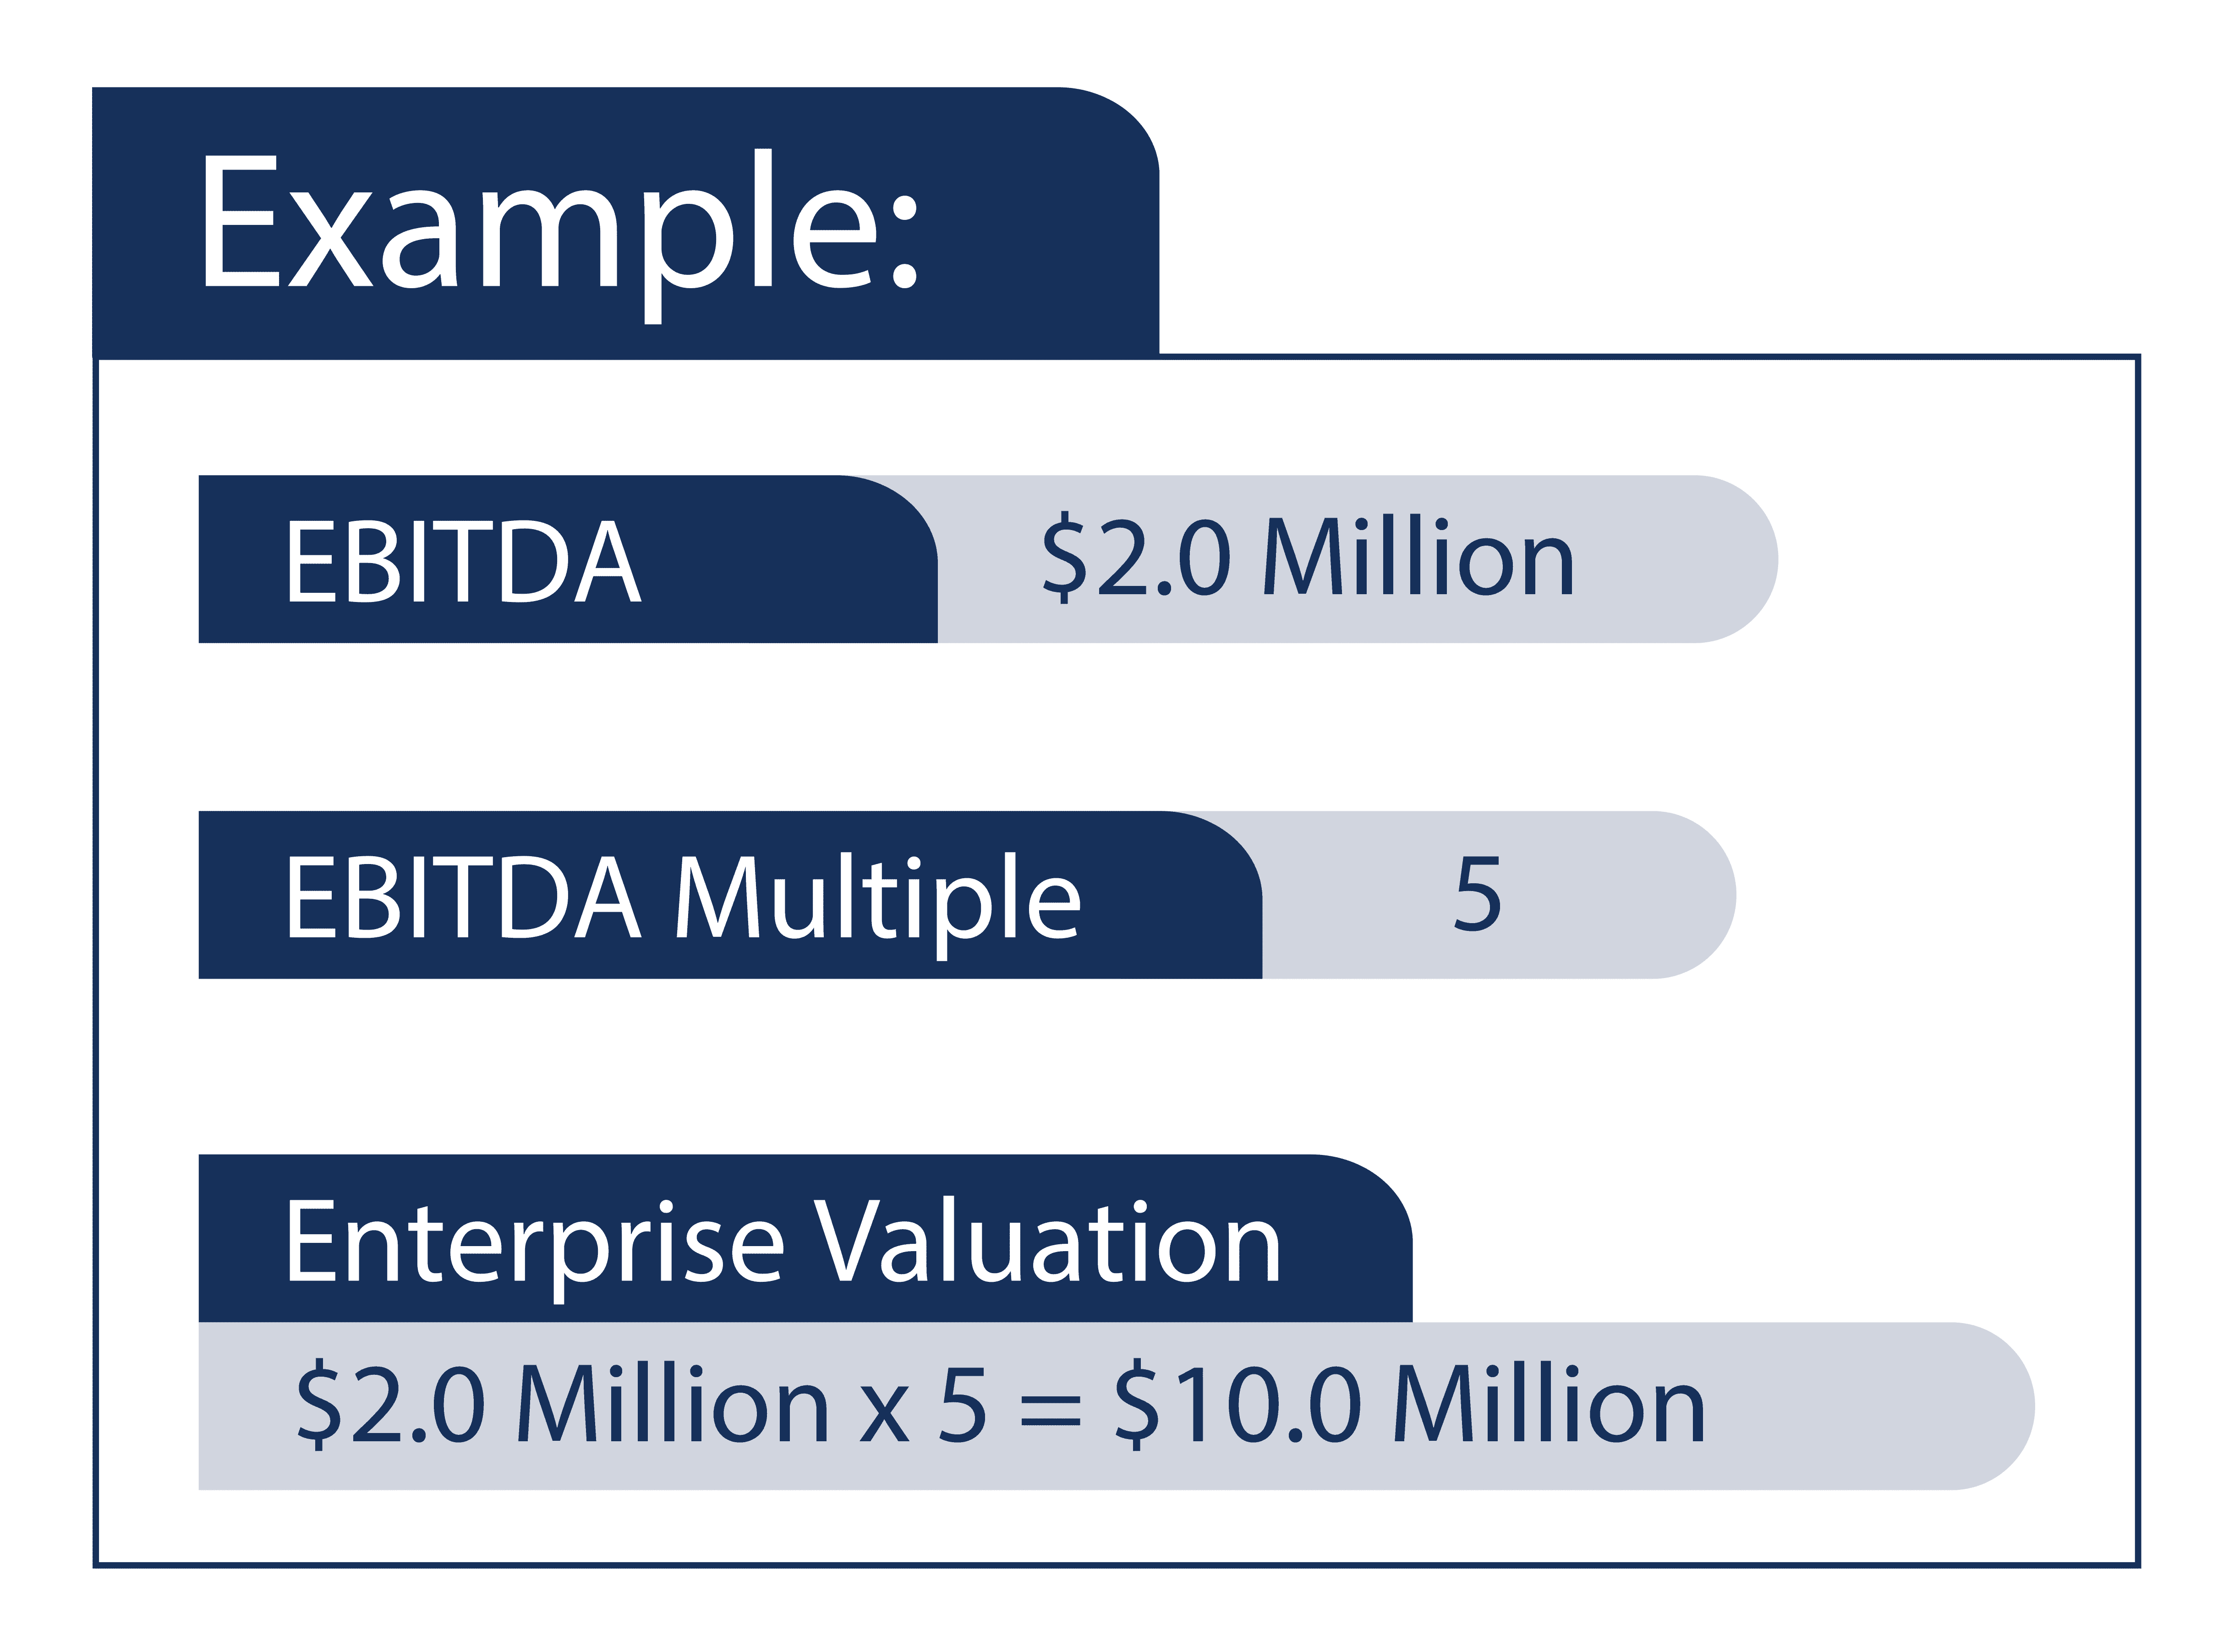
One important note that can often confuse business owners. This approach to valuation results in an Enterprise or Market Value of the target business not the Equity Value. Equity Value is the Enterprise Value less any debt plus any cash. More on Enterprise Value vs. Equity Value is available at Investopedia.
The EBITDA Multiple we use is dependent on the past and likely future consistency of a company’s EBITDA and its potential to grow over time.
For instance, a company that has just a few customers and sees its EBITDA go up and down wildly from year to year would result in a low multiple (maybe 2-4x), while a company with a very steady and growing EBITDA would attract a higher multiple (5x, or more).
Other factors that impact the EBITDA multiple include the size of a company (bigger is better), its EBITDA margin (typically, investors such as Hadley want to see EBITDA margins in excess of 10%), and the amount of capital expenditures required to maintain and grow the company.
Next Steps
If you’re a small company owner who is seeking to learn more about EBITDA and the effect it has on the value of your business, reach out to us today. Contact us to learn more.**

