

Customer Lifetime Value Definition: Customer Lifetime Value is the present value of the future cash flow contribution from a single customer during his or her entire relationship with a business.
Lifetime Value of a Customer (LTV) and Customer Lifetime Value (CLV) are used interchangeably but are the same concepts.
Throughout this post, we will use LTV.
A good LTV is an LTV that is growing over time. This post includes examples for calculating LTV, ways to improve LTV over time, and additional related topics including:
- Lifetime Value of a Customer Formula
- Is LTV Revenue or Profit?
- What is An Example of LTV?
- Customer Acquisition Costs
- Average Order Value and Gross Profits
- Customer Retention
- Churn Rate
- Customer Segmentation
- Net Present Value
- Internal Rate of Return
- Weighted Average Cost of Capital (WACC)
- Understanding Customer Lifetime Value for Your Business
Lifetime Value of a Customer Formula
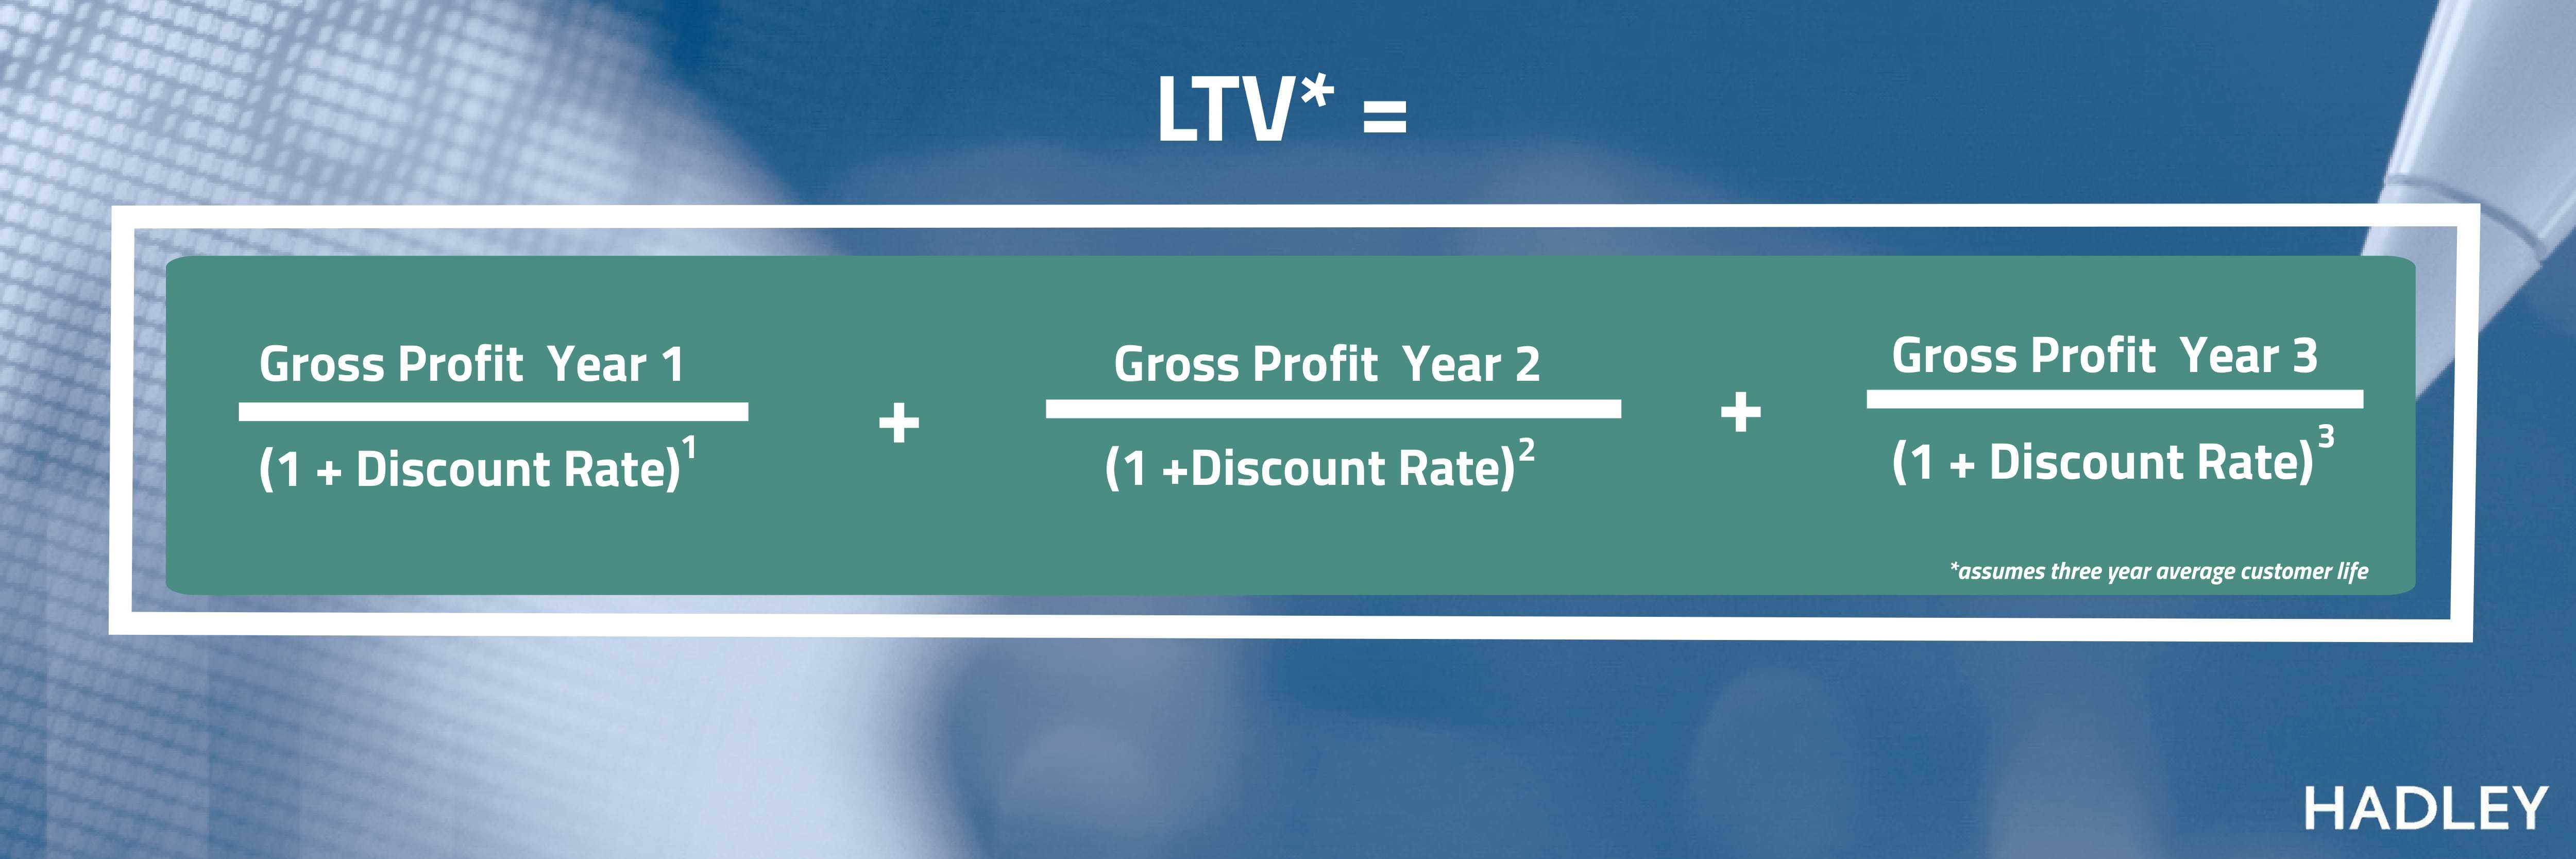
Is LTV revenue or profit?
In its simplest terms, LTV is how much a customer is worth to its supplier.
Note that the LTV is not derived from a revenue number, but a profit contribution number.
This distinction is very important.
A customer’s contribution to the profit of a business needs to incorporate all variable costs associated with that customer including but not limited to material costs, labor, fulfillment costs, shipping, customer acquisition costs, sales commissions, etc.
LTV is also the most a business should pay (or invest) to acquire a customer.
Better understanding your customer through analysis and customer segmentation also plays an important role in growing LTV. These topics are explored further below.
What is an Example of LTV?
The business world loves acronyms and buzzwords. Many are meaningless or trendy.
On the other hand, Customer Lifetime Value (CLV) aka the Lifetime Value of a Customer (LTV) is an acronym that is critical to running a successful business.
Let's discuss an example to explain why.
Bob’s Tees R Us distributes unfinished wood 3” golf tees.
That is all they do.
They buy in bulk, repackage the product into bags of 20 tees, and sell these tees directly to the end-user (golfer).
Over the past four years, the company had financial and operational results as per the table below.
The company has been able to grow and can continue to grow without adding fixed costs.
This means the gross profit of each additional order drops to the bottom line.
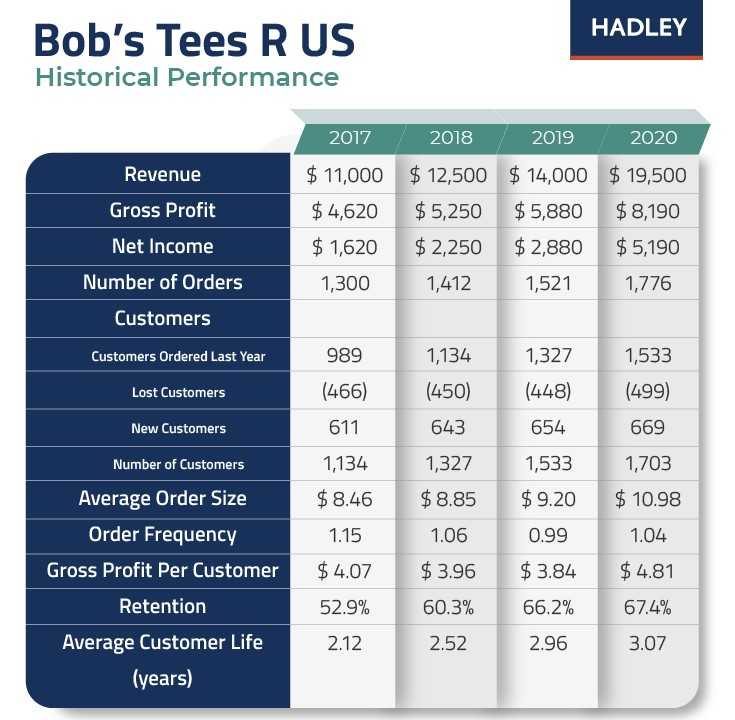
Bob has collected meaningful data about his business. The question, of course, is how he uses it to make management decisions to improve his business.
Before launching into a calculation of LTV, it’s important to understand the key inputs that contribute to and may influence LTV. Let’s dig into Bob’s Tees numbers below:
Average Order Size = Revenue / # of Orders
In 2020, ($19,500 / 1,776) = $10.98
Order Frequency = # of Orders / # of Customers
In 2020, (1,776 / 1,703) = 1.04
Gross Profit Per Customer = Gross Profit / # of Customers
In 2020, ($8,190 / 1,776) = $4.81
Retention = (Customers Last Year - Lost Customers) / Customers Last Year
In 2020, (1,533 - 499) / 1,533 = .674 = 67.4%
Average Customer Life = Customers Last Year / Lost Customers
In 2020, 1,533 / 499 = 3.07
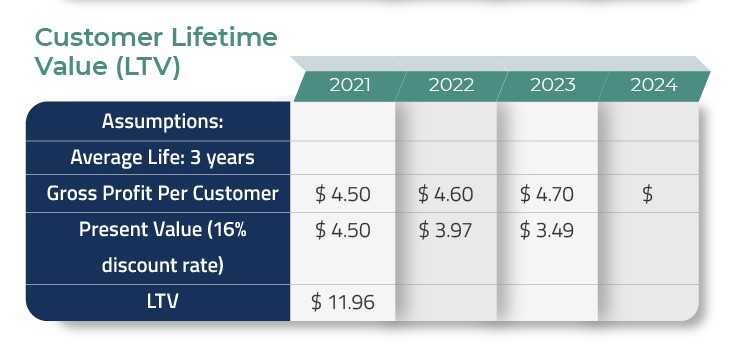
Using the historical data, and knowing that his average customer life is three years, Bob develops a three year forecast for Gross Profit per Customer.
Bob also knows that his cost of capital is about 16% so he uses this as his discount rate.
More discussions of discount rates are included below.
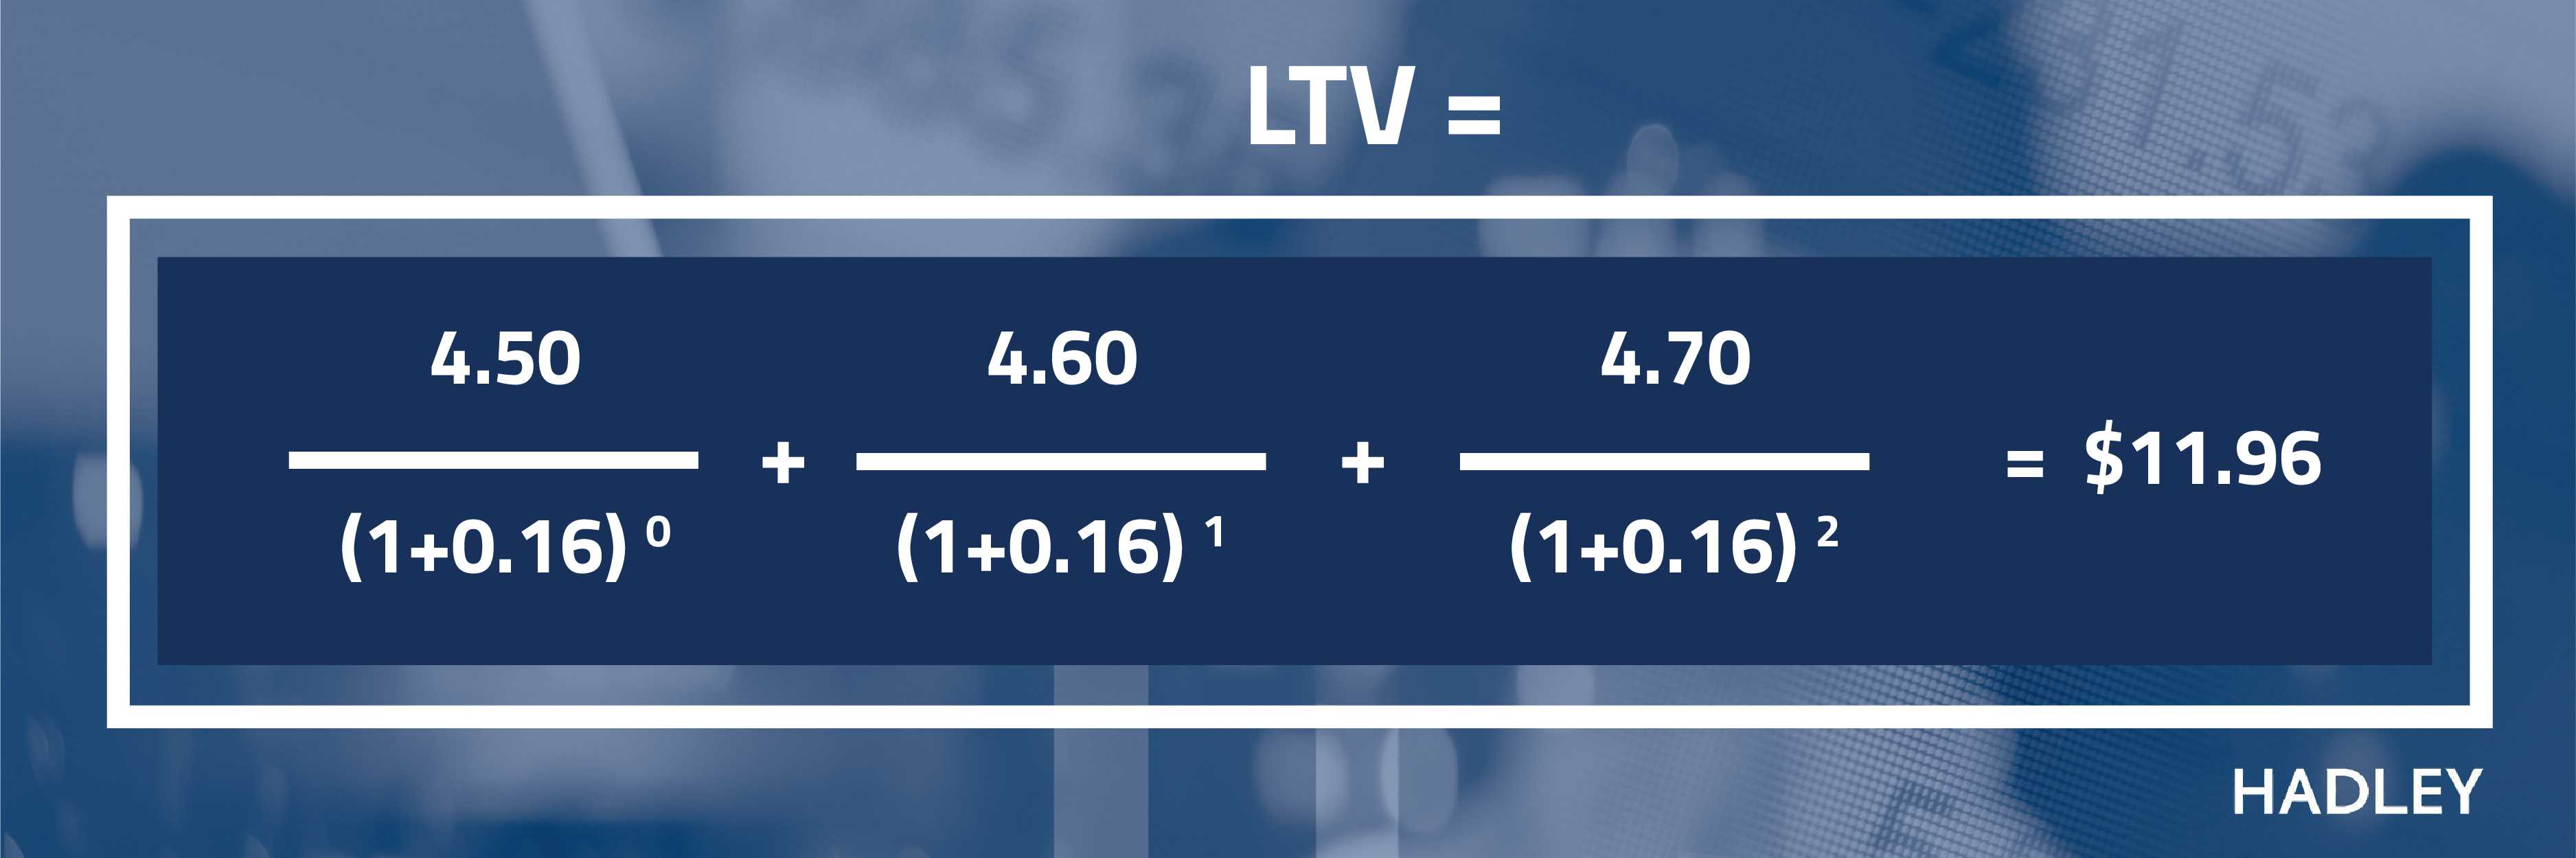
Bob calculates the present value of the Gross Profit per Customer in 2021, 2022 and 2023 and sums these three values to arrive at a LTV of $11.96.
See the chart and formula below.
The sections below address several important concepts that contribute to calculating LTV and factors that may impact LTV.
Customer Acquisition Costs
Customer acquisition costs include all expenses associated with identifying and converting prospects into actual customers.
These costs (or investments) can include but are not limited to:
- Buying mailing lists and sending out printed catalogs
- Online advertising like pay per click (PPC)
- Direct salespeople and their expenses
If the LTV of Bob’s customers is currently $11.96, in theory, Bob should be willing to spend up to that amount to acquire a new customer.
Accurately tracking and continually lowering customer acquisition costs can improve LTV.
Average Order Value and Gross Profit
Average order value (AOV) and gross profit are key metrics and increasing either one (or both) can have a significant impact on the profitability of the company.
- Average Order Value = Total Revenue / # of Orders
-
- In our example above in 2020:
- ($19,500/1,776) = $10.98
- Gross Profit = Revenue - Cost of Goods Sold
- Gross Profit is the profit a company makes after deducting all the costs associated with making and selling its products, or the costs associated with providing its services.
- Cost of Goods Sold (COGS) is the total of all costs associated with making a good or service and usually includes materials, labor, and overhead.
Bob would like to increase both his order value and his gross profit margin.
Bob knows that some golfers like 4” tees and he thinks they may like them in different colors.
In addition, a customer asks Bob if he sells ball mark repair tools.
Bob adds a few of these to his product mix.
After researching competitors, Bob feels he can charge a premium for these new items.
Bob is very pleased to see that the new products appear to be a success.
In the first month after introducing these products, his Average Order Value (AOV) increases to $17.00 and the gross margin percentage increases to 49%.
Assuming the same average customer life and order frequency, what impact do these changes have on Bob’s LTV?
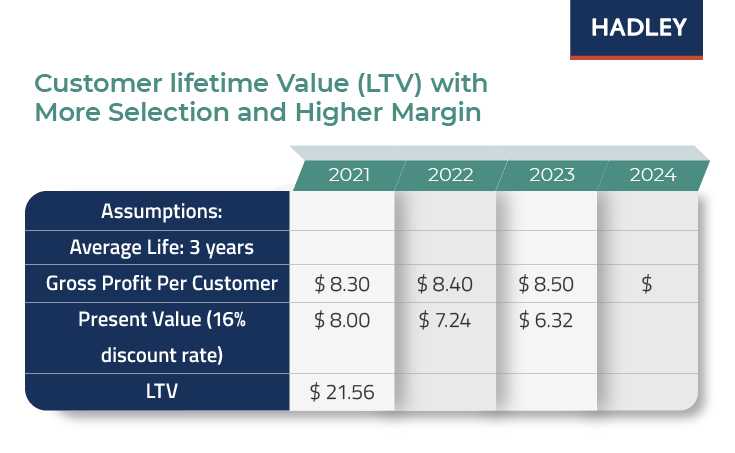
Gross Profit Per Customer = AOV x Gross Profit %
$17 x 49% = $8.30
Bob added tremendous value to his business by nearly doubling the LTV just by adding a few additional products to his offering.
Customer Retention
Customer retention is another variable that has a significant impact on LTV.
Customer Retention is engaging existing customers to continue purchasing your goods or services.
Customer Retention = (Customers Last Year - Lost Customers) / Customers Last Year
In 2020 Bob’s Tees had a customer retention rate of 67.4%.
(1,533 - 499) / 1,533 = .674 = 67.4%
Churn Rate
Churn Rate is the percentage of customers who terminate their relationship in any given period.
Churn Rate = 1 - Retention Rate.
In 2020, Bob’s Tees had a Churn Rate of 32.6%
1 - .674 = .326 = 32.6%
The current customer is often the best customer and keeping them adds to LTV. Below are some of the ways companies retain customers:
- Good customer service
- Same day shipping
- Product quality
- Product variety,
- Competitive prices
Bob is so happy with the success of his new product offerings and the big jump in AOV that he decides to go fishing for two months.
Since he has no employees, no orders will ship during these two months.
He anticipates that these customers may be unhappy and probably will not return.
However, he does not care – his LTV is now more than $20 per customer!
When he returns from the fishing trip, he sees his customer ratings have plummeted and social media is roasting him.
Doing some quick calculations, Bob thinks that his customer retention has been cut in half!
-
New Customer Retention = 67.4% / 2 = 33.7%
- # of Lost Customers = # of Customers * Churn Rate = 1,533 * (1 - .337) = 1,016
-
New Average Customer Life = # of Customers / Lost Customers
- 1,533 / 1,016 = 1.5 years
The average customer life was cut in half, too!
What does this mean to Bob’s LTV?
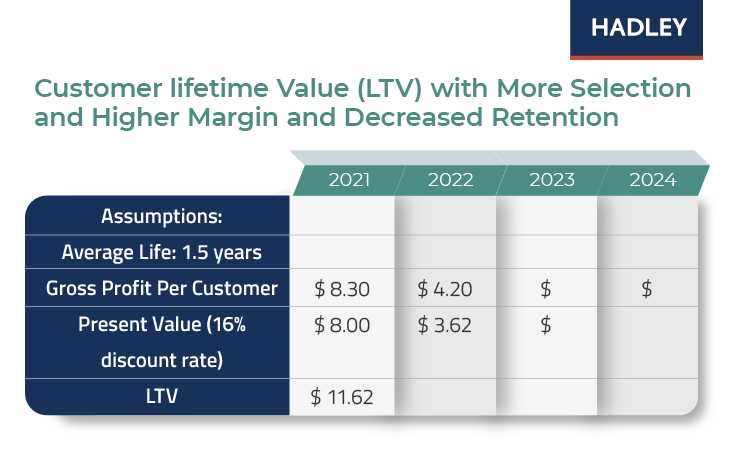
Bob got a quick lesson in the value of retaining existing customers.
This was an expensive fishing trip!
His LTV declined from more than $20 to $11.62 because his Average Customer Life declined from 3 years to 1.5 years.
Customer Segmentation
Customer Segmentation is studying your customers and dividing them into various segments or groups with common characteristics.
Bob liked things better when the LTV was growing, not shrinking, and he decided he needed to make some better decisions.
Attending webinars and reading business books introduced Bob to the important concept of customer segmentation.
In customer segmentation, companies use common customer characteristics to target their market more effectively and better meet the needs of their customers based on who they are and where they’re from.
Segmentation studies can be very detailed and often include data like age, race, gender, marital status, occupation, etc.
Bob’s business decided to start simple: where do its customers live?
After reviewing all of his shipment history, Bob was surprised to learn that 60% of his customers live in Texas, 30% in Florida, and the balance elsewhere.
Bob decided to allocate more marketing and customer acquisition resources to Texas since so many of his customers are located there.
He tested this strategy by introducing a burnt orange tee and purchasing banner ads on the local Texas golf association website to announce this new product.
Testing ideas, tracking the outcomes, and regularly calculating the impact on LTV are necessary to continually fine-tune and incrementally improve the business and increase LTV.
Early results indicate that Texans love a burnt orange tee.
And, better yet, they will pay more for a burnt orange tee than a plain white tee even though Bob’s costs are the same.
Bob has done enough LTV calculations to know that when his gross margin per customer goes up, his LTV goes up!
Bob is also smart enough to know that the discount rate he uses to calculate the present value of future customer cash flows will have a significant influence on his LTV.
To make sure he’s using an accurate discount rate, Bob refreshes his knowledge of net present value, discount rates, and weighted average cost of capital.
Net Present Value
At its core, LTV is a Net Present Value calculation.
Bob is using Net Present Value (NPV) to decide how to allocate capital - a limited resource for Bob - into competing projects for growing LTV.
Net Present Value is a method of calculating your profitability for a project or expenditure.
Because projects have various budgets and timelines, calculating net present value (NPV) is a helpful tool to get an “apples to apples” comparison.
NPV compares the present value of the cash flows at the required rate of return (also called the discount rate) of your project to your initial investment to determine whether to make the investment. Read more about NPV here.
Projects with a negative NPV are typically not pursued.
NPV in conjunction with internal rate of return (IRR) allows management to select the projects with the highest return and the greatest impact on the business – typically the largest NPV and the highest IRR.
Internal Rate of Return
Internal Rate of Return (IRR) is used in financial analysis to estimate the profitability of projects or investments.
The internal rate of return is a discount rate that makes the net present value (NPV) of all the project cash flows equal to zero. More on IRR is available here.If the IRR of a project exceeds Bob’s discount rate of 16% then the project is a go. If it does not, then Bob will pass on the project.
Calculating the LTV of a customer on a net present value basis gives management the tool it needs to determine how much to invest in customer acquisition – or whether or not customer acquisition is even a top priority.
One of the best ways for calculating the discount rate is the weighted average cost of capital (WACC).
Weighted Average Cost of Capital
Weighted Average Cost of Capital (WACC) calculates a firm's cost of capital in which each category of capital is proportionately weighted.
All sources of capital, including common stock, preferred stock, bonds, and any other long-term debt, are included in a WACC calculation.
In its simplest form, WACC factors in:
- The Cost of Debt (the interest rate you pay the bank)
- The Cost of Equity (the return your investors want on their invested equity capital)
- What Portion of the Capital Structure Each Represents.
To see how the math is broken down, see the example below.
Bob’s analysis assumes the following capital structure for Bob’s Tees:
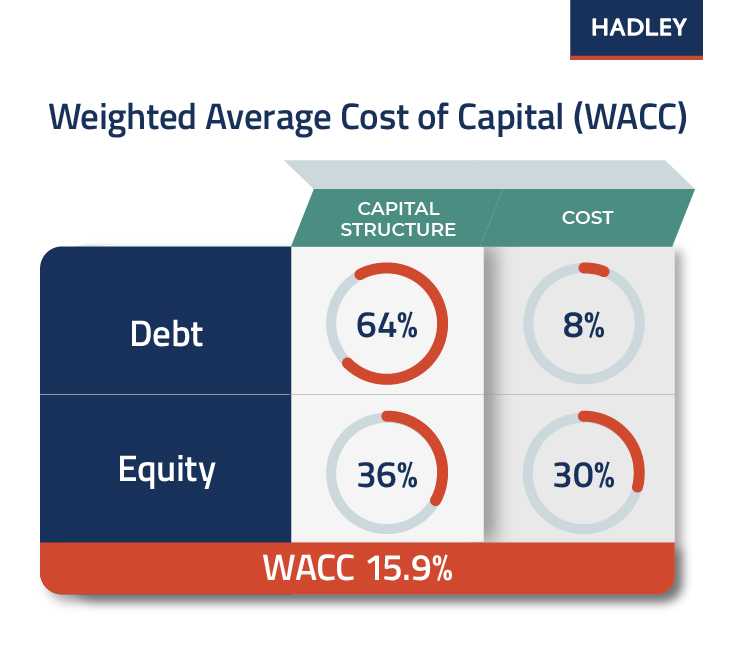
To explain this further, the following formula is used for calculating WACC:
Debt Equity
WACC = (% of Capital Structure x Cost) + (% of Capital Structure x Cost)
So, when Bob plugs in the numbers from the table above we see the following:
\ Debt Equity
WACC = (.64 x .08) + (.36 x .30) = .1592
Because this number is generally represented as a percentage, we then take the decimal times 100 as shown below.
WACC = .1592 x 100 =15.9%
By calculating WACC, Bob confirms that his discount rate is 15.9%. The lower Bob’s discount rate, the higher his LTV. To the extent that Bob can source cheaper sources of financing, like debt financing, to replace more expensive costs of financing, like equity financing, the more he can increase his LTV.
Understanding Customer Lifetime Value for Your Business
Customer Lifetime Value and the impact operating decisions have on it, are important concepts for management teams to understand and to use in daily decision-making.
LTV is a dynamic output, not an input.
LTV will change over time depending on the success (or failures) of management decisions and the impact on key variables such as retention rates, AOV, gross profit, and discount rates.
Being aware of your LTV ultimately helps the financial health of your business allowing you to make informed financial decisions.
If you’d like to talk to us more about additional steps you can take to improve your company’s financial health, contact us today for a confidential consultation.

